Wednesday 15 MAR 2006

Home page

DWS ARCHIVE
2024 2023 2022 2021 2020 2019 2018 2017 2016 2015 2014 2013 2012 2011 2010 2009 2008 2007 2006 2005 2004 2003
Before 2003

About the DWS

2006

Dec

M Tu W Th F Sa Su
        01 02 03
04 05 06 07 08 09 10
11 12 13 14 15 16 17
18 19 20 21 22 23 24
25 26 27 28 29 30 31

Nov

M Tu W Th F Sa Su
    01 02 03 04 05
06 07 08 09 10 11 12
13 14 15 16 17 18 19
20 21 22 23 24 25 26
27 28 29 30      

Oct

M Tu W Th F Sa Su
            01
02 03 04 05 06 07 08
09 10 11 12 13 14 15
16 17 18 19 20 21 22
23 24 25 26 27 28 29
30 31          

Sept

M Tu W Th F Sa Su
        01 02 03
04 05 06 07 08 09 10
11 12 13 14 15 16 17
18 19 20 21 22 23 24
25 26 27 28 29 30  

August

M Tu W Th F Sa Su
  01 02 03 04 05 06
07 08 09 10 11 12 13
14 15 16 17 18 19 20
21 22 23 24 25 26 27
28 29 30 31      

July

M Tu W Th F Sa Su
          01 02
03 04 05 06 07 08 09
10 11 12 13 14 15 16
17 18 19 20 21 22 23
24 25 26 27 28 29 30
31            

June

M Tu W Th F Sa Su
      01 02 03 04
05 06 07 08 09 10 11
12 13 14 15 16 17 18
19 20 21 22 23 24 25
26 27 28 29 30    

May

M Tu W Th F Sa Su
01 02 03 04 05 06 07
08 09 10 11 12 13 14
15 16 17 18 19 20 21
22 23 24 25 26 27 28
29 30 31        

April

M Tu W Th F Sa Su
          01 02
03 04 05 06 07 08 09
10 11 12 13 14 15 16
17 18 19 20 21 22 23
24 25 26 27 28 29 30

March

M Tu W Th F Sa Su
    01 02 03 04 05
06 07 08 09 10 11 12
13 14 15 16 17 18 19
20 21 22 23 24 25 26
27 28 29 30 31    

February

M Tu W Th F Sa Su
    01 02 03 04 05
06 07 08 09 10 11 12
13 14 15 16 17 18 19
20 21 22 23 24 25 26
27 28          

January

M Tu W Th F Sa Su
            01
02 03 04 05 06 07 08
09 10 11 12 13 14 15
16 17 18 19 20 21 22
23 24 25 26 27 28 29
30 31          

Monthly summaries:
from BoM

Find a place:
Google Maps |
Aust Gazetteer|
Geonames

Weather terms:
WeatherZone | BoM |
American Met Soc | NOAA | uk.sci.weather | India Meteorological Department

National Daily Weather Summary

Records set | Charts | Cities | Hottest | Coldest | Rain, sun & wind | Downpours & gales
State extremes | Noteworthy weather | Capital Cities | Regional Cities | Alpine Stations
Charts and data courtesy Bureau of Meteorology. MTSAT-1R operated by JMA
Noteworthy weather today
significant newsworthy major

WA: Record flood in the Murchison approaches Kalbarri

Record rains from Tropical Cyclone Emma (see DWS for 1 March) continue to produce record flood levels in the Murchison River as the flood peak approaches Kalbarri and the sea. At Emu Springs, about 30km NE of the town, the river peaked at 7.8m early this morning, about 0.4m higher than the previously highest recorded flood peak in 1960. The river is up to 16km wide in places and extensive building and fence damage and stock losses have been reported on at least 8 pastoral properties in the catchment. Murchison House station, 10km NE of Kalbarri, was evacuated yesterday as floodwaters up to 2m deep entered the homestead, and there were fears that the original 1850s mudbrick cottage would not survive water erosion. Farther inland, Mileura Station was flooded for the first time in 120 years.

In Kalbarri, the rivermouth was closed to shipping on Tuesday after rising, fast-flowing floodwaters pinned a boat against Oyster Reef at the northern entrance to the river. Professional fishing operations were moved to Port Gregory, 50km to the south. Residents and State Emergency Services volunteers, aided by students given time off from school, constructed two sandbag levees to protect the town, one 400m by 1m high and a second 500m long by 2m high. The levees held as the flood peaked in Kalbarri during Thursday 16 March, with only low-lying areas of the town flooding.

WA, NT, QLD: Monsoon rain and flooding continue

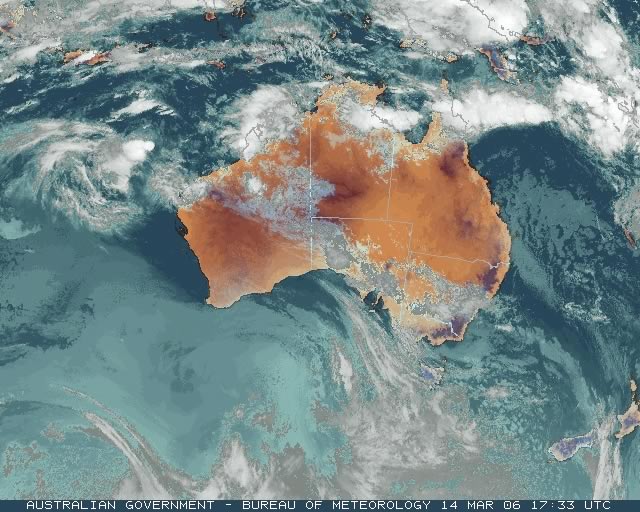
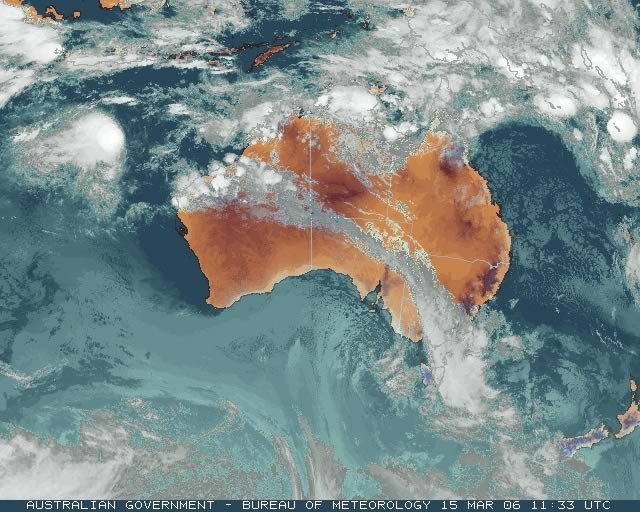
The active monsoon trough visible in the surface charts below continues to produce widespread heavy rain and storms across the northern tropics. On Cape York Peninsula, Lockhart River Airport recorded 136.8mm between 3 and 7pm. Highest falls for the 24 hours to 9am are listed in wettest and shorter duration falls through the day are given in downpours. Minor flooding continues in QLD in the lower Tully River, in the Thomson River around Longreach, Cooper Creek around Windorah, Norman River near Yappar River and the Georgina around Urandangi.

NSW, VIC: Useful rain in SE NSW, NE VIC

A trough moving across SE Australia gave useful if variable falls from showers in NE VIC and parts of the NSW South Coast and Southern Tablelands this afternoon and evening. The heaviest totals were on the Alps (Mt Hotham 41.4mm and Perisher Valley 35.0 to 9am Thursday), but many locations recorded 10 to 20mm, their heaviest rain in nearly two months.


Records set or equalled today

These records are based on data received as at 1455 EST on 30/12/2006. Help in interpreting these statistics and information on quality control is here.

District Site Today Previous monthly record Previous all time record
if equalled or broken
Comments
Reading Reading Date Years Reading Date Years
Highest daily rainfall

WA

W Kimberley

003082

KIRBY GARDENS

95.0

88.0

27/03/2004

16


The day in charts
Surface charts Satellite images Rain & temperatures
4am EST Rainfall -- 24 hours to 9am
Available about 6am EST Available about 4am EST Available about 2pm EST
Week to 9am | SE AUS detail
10am EST Minimum temperature +/- normal
Available about noon EST Available about 10am EST Available about 2pm EST next day
Actual temperatures
4pm EST Maximum temperature +/- normal
Available about 6pm EST Available about 4pm EST Available about 2pm EST next day
Actual temperatures
10pm EST Solar Radiation
Available about midnight EST Available about 10pm EST Available about 2am EST next day

Summary of observations

For notes on how to interpret the data and quality control issues, see Daily Weather Summary Help.
**S** and **W** precede data flagged by the Bureau as suspicious or wrong
Data is as received at 22:23EST, 14/05/2012.

Major centres
Max
° C
+/- norm
° C
Min
° C
+/- norm
° C
Grass Min
° C
Rain to 9am mm Evaporation to 9am mm Sunshine hours Wind Run to 9am km (24-hour average km/h) Maximum Gust km/h / hour of occurrence
GERALDTON AIRPORT 38.1 +7.2 20.1 +2.2 18.7 0.0 11.6 -- 710 (29.6) 52/07
PERTH AIRPORT 32.6 +3.0 16.9 +1.1 13.5 0.0 10.2 11.3 597 (24.9) 63/07
ALBANY AIRPORT 21.0 -3.1 15.5 +2.1 15.3 0.6 4.2 5.3 377 (15.7) 43/14
BUNBURY 29.6 +2.1 12.2 -1.8 -- 0.0 -- -- 447 (18.6) 41/01
MANDURAH 30.4 -- 16.4 -- -- 0.0 -- -- 461 (19.2) 41/00
DARWIN AIRPORT 27.4 -4.5 23.7 -0.8 23.7 56.8 0.8 0.0 401 (16.7) 48/21
ALICE SPRINGS AIRPORT 37.1 +4.4 20.4 +2.9 17.0 0.0 12.0 11.4 308 (12.8) 41/10
WHYALLA AERO 23.7 -3.6 17.2 +1.9 -- 1.6 8.2 -- 313 (13.0) 35/14
ADELAIDE (KENT TOWN) 23.0 -3.3 12.8 -2.4 8.7 0.0 4.6 9.6 168 ( 7.0) 41/22
MOUNT GAMBIER AERO 24.4 +1.3 7.0 -3.5 5.3 0.0 4.6 9.6 234 ( 9.8) 41/17
MOUNT ISA AERO 34.3 0.0 25.2 +3.4 22.9 0.0 10.6 9.6 383 (16.0) 45/09
CAIRNS AERO 30.1 -0.4 23.3 +0.3 22.0 2.2 4.4 5.3 539 (22.5) 45/10
TOWNSVILLE AERO 30.8 +0.1 21.5 -1.4 19.4 2.4 9.6 6.8 522 (21.8) 50/15
MACKAY M.O 29.3 +0.7 23.9 +1.7 -- 0.4 -- 6.8 539 (22.5) 46/09
ROCKHAMPTON AERO 31.0 +0.5 21.3 +0.5 19.6 0.0 7.8 -- 368 (15.3) 39/11
BUNDABERG AERO 29.3 +0.2 21.2 +1.3 -- 0.0 7.2 -- 429 (17.9) 39/13
NAMBOUR DPI 28.0 +0.1 17.2 -1.0 -- 0.0 3.4 -- -- --
COOLANGATTA 27.6 +0.4 18.3 -1.3 -- 0.0 -- -- 170 ( 7.1) 34/17
BRISBANE AERO 27.7 -0.3 19.9 +0.6 16.5 0.0 4.8 4.8 262 (10.9) 28/10
TOOWOOMBA AIRPORT 25.2 -1.2 15.5 -0.6 -- 0.0 -- -- 487 (20.3) 43/11
GUNNEDAH (DIPNR) 34.3 +5.2 22.1 +5.5 18.5 0.0 8.1 -- 149 ( 6.2) --
COFFS HARBOUR MO 27.2 +1.3 18.4 +0.3 15.0 0.0 4.2 10.4 301 (12.5) 35/16
PORT MACQUARIE AIRPORT AWS 28.9 +2.6 16.5 -0.2 -- 0.0 -- -- -- --
WILLIAMTOWN RAAF 29.1 +2.9 20.8 +4.5 20.4 0.0 5.2 4.5 383 (16.0) 34/19
GOSFORD (NARARA RESEARCH STATION) AWS 24.6 -1.4 20.4 +5.1 19.6 0.4 -- -- 153 ( 6.4) 17/09
ORANGE AGRICULTURAL INSTITUTE 27.1 +4.3 16.7 +6.1 13.0 1.0 3.8 1.8 -- --
DUBBO AIRPORT AWS 34.5 +5.4 21.2 +6.7 -- 0.0 -- -- -- --
SYDNEY AIRPORT AMO 27.3 +2.1 21.0 +3.6 17.8 0.0 4.0 0.8 438 (18.3) 35/18
RICHMOND RAAF 25.1 -1.8 19.9 +4.4 -- 6.0 -- -- 189 ( 7.9) 43/00
BELLAMBI AWS 24.6 +0.7 19.6 +1.6 -- 4.2 -- -- 304 (12.7) 48/21
CANBERRA AIRPORT 29.2 +4.7 17.3 +6.6 16.9 0.0 7.6 4.0 346 (14.4) 61/18
WAGGA WAGGA AMO 32.9 +5.2 14.2 +0.8 13.5 0.0 7.0 5.3 225 ( 9.4) 54/15
ALBURY AIRPORT AWS 26.8 -1.1 11.1 -1.5 -- 0.0 -- -- -- --
MILDURA AIRPORT 20.4 -7.9 13.5 -0.3 12.4 0.6 6.2 0.1 223 ( 9.3) 26/18
TATURA INST SUSTAINABLE AG 20.2 -6.1 6.8 -4.9 8.1 0.0 4.7 -- 280 (11.7) 26/13
BENDIGO AIRPORT 21.3 -4.7 7.9 -3.4 -- 0.0 -- -- 327 (13.6) 28/14
MELBOURNE REGIONAL OFFICE 23.2 -0.7 12.0 -1.2 9.5 0.0 4.0 -- 126 ( 5.3) 22/17
GEELONG AIRPORT 22.1 -1.1 9.3 -2.5 -- 0.0 -- -- 215 ( 9.0) 26/13
BALLARAT AERODROME 22.6 +0.4 8.6 -1.3 -- 0.0 -- -- 468 (19.5) 37/22
LAUNCESTON (TI TREE BEND) 21.0 -1.5 6.2 -3.8 -- 0.0 -- -- 115 ( 4.8) 21/12
HOBART AIRPORT 20.2 -0.5 8.1 -2.6 5.9 0.0 3.0 7.8 256 (10.7) 28/17
Max
° C
+/- norm
° C
Min
° C
+/- norm
° C
Grass Min
° C
Rain to 9am mm Evaporation to 9am mm Sunshine hours Wind Run to 9am km Maximum Gust km/h / hour of occurrence
Hottest
Highest maximum temperature>Greatest variation above normal maximum Highest minimum temperatureGreatest variation above normal minimum

40.9 CARNARVON AIRPORT W Gascoyne WA
40.6 KALBARRI Central West WA
40.1 SHARK BAY AIRPORT W Gascoyne WA
40.0 EMU CREEK STATION W Gascoyne WA
40.0 MOOMBA AIRPORT NE Pastoral SA
40.0 WHITE CLIFFS POST OFFICE Far Northwest NSW

+9.4 : 40.9 CARNARVON AIRPORT W Gascoyne WA
+9.0 : 39.9 DENHAM W Gascoyne WA
+8.3 : 40.0 WHITE CLIFFS POST OFFICE Far Northwest NSW
+8.1 : 40.6 KALBARRI Central West WA
+7.5 : 38.9 WILCANNIA (REID ST) Far Northwest NSW

29.0 NORTHERN ENDEAVOUR Islands ISL
27.8 THEVENARD ISLAND W Pilbara WA
27.6 ONSLOW W Pilbara WA
27.5 ONSLOW AIRPORT W Pilbara WA
27.0 VARANUS ISLAND Islands ISL
27.0 GREEN ISLAND N Coast--Barron QLD
27.0 WILLIS ISLAND COMPARISON Islands ISL

+8.4 : 24.7 COBAR AIRPORT AWS Upper Darling NSW
+8.1 : 22.0 WELLINGTON (AGROWPLOW) CW Slopes S NSW
+8.0 : 18.7 YOUNG AIRPORT SW Slopes N NSW
+7.8 : 21.2 QUIRINDI POST OFFICE NW Slopes S NSW
+7.6 : 20.0 COWRA AIRPORT COMPARISON CW Slopes S NSW

Coldest
Lowest maximum temperatureGreatest variation below normal maximum Lowest minimum temperatureGreatest variation below normal minimum

10.7 MOUNT WELLINGTON Southeast TAS
10.8 MOUNT READ W Coast TAS
12.8 LIAWENEE Central Plateau TAS
13.3 MT HOTHAM Upper NE VIC
13.4 MOUNT BULLER Upper NE VIC

-10.0 : 18.5 SWAN HILL AERODROME Mallee S VIC
-8.7 : 19.1 KERANG Lower North VIC
-8.5 : 25.5 WARBURTON AIRFIELD Interior WA
-8.4 : 22.0 WOOMERA AERODROME NW Pastoral SA
-8.2 : 24.0 ROXBY DOWNS (OLYMPIC DAM AERODROME) NW Pastoral SA

1.3 LIAWENEE Central Plateau TAS
1.4 LAKE LEAKE (ELIZABETH RIVER) E Coast TAS
1.8 LAKE ST CLAIR NATIONAL PARK Central Plateau TAS
1.9 MOUNT WELLINGTON Southeast TAS
1.9 TARRALEAH VILLAGE Derwent Valley TAS

-10.0 : 4.3 EYRE Eucla WA
-7.0 : 5.5 FLINDERS ISLAND AIRPORT Flinders Is/Bass St TAS
-6.6 : 2.7 SMITHTON AERODROME N Coast TAS
-6.3 : 4.6 RUTHERGLEN RESEARCH Lower NE VIC
-5.4 : 2.5 CRESSY RESEARCH STATION N Coast TAS

Wettest
Sunniest & dullest
Windiest
Highest gusts
Todays highest rainfall totals for the 24 hours to 9am. It includes the top 5 totals nationally followed by all reported falls of 50mm or more.
Highest and lowest recordings of hours of sunshine for the 24 hours to midnight.
Highest wind run totals in kilometres for the 24 hours to 9am (average speed in brackets). All reported runs > =25km/h are shown.
Highest wind gusts in km/h for the 24 hours to midnight followed by the hour in which it occurred. All stations with gusts > 89km/h are shown.
189.0 EURAMO TM N Coast--Herbert QLD
178.0 HAZELMERE N Coast--Barron QLD
177.8 CENTRE ISLAND N Rivers NT
150.0 HOPE VALE N Coast--Barron QLD
149.0 MOUNT OLIVE N Coast--Barron QLD

WESTERN AUSTRALIA
W Kimberley
95.0 KIRBY GARDENS
50.0 WEST ROEBUCK
E Pilbara
100.0 MUNDABULLANGANA
W Pilbara
72.2 FORTESCUE ROAD HOUSE

NORTHERN TERRITORY
N Rivers
177.8 CENTRE ISLAND
113.8 WAGAIT BEACH
100.4 COX PENINSULA TRANSMITTER
83.4 DARWIN BOTANIC GARDENS
73.4 CENTRAL ARNHEM PLATEAU
67.2 LUDMILLA
66.0 PIRLANGIMPI
65.0 LIMMEN RIVER
65.0 LEADERS CREEK
64.5 NT UNIVERSITY
64.4 DARWIN AIRPORT COMPARISON
62.8 WALKER CREEK
59.6 CHANNEL POINT
58.8 MARRARA
56.8 DARWIN AIRPORT
55.4 STOKES HILL
55.4 LEANYER
52.6 BLACK POINT
51.4 CSIRO BERRIMAH
50.0 TERRITORY WILDLIFE PARK
50.0 ELSEY

QUEENSLAND
N Peninsula
97.8 COEN AIRPORT (OLD SITE)
93.6 COEN AIRPORT
82.0 COEN POST OFFICE
N Coast--Barron
178.0 HAZELMERE
150.0 HOPE VALE
149.0 MOUNT OLIVE
132.0 COOKTOWN MISSION STRIP
108.2 COOKTOWN AIRPORT
67.8 SHIPTONS FLAT
60.6 CAPE FLATTERY
60.0 DAINTREE VILLAGE
N Coast--Herbert
189.0 EURAMO TM

11.5 MOREE AERO NW Plains E NSW
11.4 ALICE SPRINGS AIRPORT N Plateau NT
11.3 PERTH AIRPORT Lower West WA
10.6 INVERELL RESEARCH CENTRE N Tablelands W NSW
10.5 WARWICK Darling Downs E QLD

.....

0.8 SYDNEY AIRPORT AMO Sydney--east NSW
0.1 MILDURA AIRPORT Mallee N VIC
0.0 DARWIN AIRPORT N Rivers NT
0.0 LARRIMAH N Rivers NT
0.0 WEIPA AERO N Peninsula QLD

1124 (46.8) HAMILTON ISLAND AIRPORT Central Coast E QLD
867 (36.1) CAPE LEEUWIN Lower West WA
830 (34.6) ROTTNEST ISLAND Lower West WA
829 (34.5) RUNDLE ISLAND Wide Bay/Burnett QLD
803 (33.5) NORTH ISLAND Central West WA
754 (31.4) THREDBO AWS Snowy Mtns NSW
730 (30.4) LADY ELLIOT ISLAND Wide Bay/Burnett QLD
710 (29.6) GERALDTON AIRPORT Central West WA
708 (29.5) PEARCE RAAF Lower West WA
703 (29.3) GARDEN ISLAND HSF Lower West WA
697 (29.0) CAPE FLATTERY N Coast--Barron QLD
675 (28.1) CENTRE ISLAND N Rivers NT
669 (27.9) CAPE NATURALISTE Lower West WA
653 (27.2) HERON ISLAND RES STN Wide Bay/Burnett QLD
647 (27.0) LUCINDA POINT N Coast--Herbert QLD
639 (26.6) ALVA BEACH Central Coast E QLD
607 (25.3) DOUBLE ISLAND POINT LIGHTHOUSE Brisbane/SE Coast QLD
91/17 MT HOTHAM Upper NE VIC
80/11 THREDBO AWS Snowy Mtns NSW
76/20 TIBOOBURRA AIRPORT Far Northwest NSW
74/19 WILCANNIA AERODROME AWS Far Northwest NSW
74/14 BROKEN HILL AIRPORT AWS Lower Darling NSW

Downpours High AWS wind reports
High rainfall for periods of 6 hours or less from AWS and synoptic reports. Storm force gusts (>89km/h) and 10-minute mean gales (>62km/h) reported by AWSs. Wind direction and mean windspeed are shown in brackets.
WESTERN AUSTRALIA
N Kimberley
KALUMBURU
25.2mm in 1 hr to 17:00 25.2mm/h
12.6mm in 1 hr to 18:00 12.6mm/h
38.0mm in 3 hr to 18:00 12.7mm/h
TRUSCOTT
22.0mm in 1 hr to 13:00 22.0mm/h
22.0mm in 3 hr to 15:00 7.3mm/h
W Kimberley
BROOME AIRPORT
15.0mm in 30 min to 01:00 30.0mm/h
15.0mm in 1 hr to 01:00 15.0mm/h
8.2mm in 13 min to 01:13 37.8mm/h
24.0mm in 1 hr to 01:30 24.0mm/h
5.8mm in 3 min to 01:45 116.0mm/h
10.0mm in 15 min to 02:00 40.0mm/h
29.6mm in 1 hr to 02:00 29.6mm/h
21.8mm in 1 hr to 02:30 21.8mm/h
46.0mm in 3 hr to 03:00 15.3mm/h
CURTIN AERO
14.0mm in 1 hr to 00:00 14.0mm/h
29.0mm in 3 hr to 00:00 9.7mm/h
WEST ROEBUCK
10.2mm in 30 min to 01:00 20.4mm/h
10.2mm in 1 hr to 01:00 10.2mm/h
14.8mm in 30 min to 01:30 29.6mm/h
25.0mm in 1 hr to 01:30 25.0mm/h
22.6mm in 30 min to 02:00 45.2mm/h
37.4mm in 1 hr to 02:00 37.4mm/h
23.2mm in 1 hr to 02:30 23.2mm/h
48.0mm in 3 hr to 03:00 16.0mm/h
NORTHERN TERRITORY
N Rivers
DARWIN AIRPORT
18.0mm in 3 hr to 09:30 6.0mm/h
GUNN POINT
9.8mm in 10 min to 02:00 58.8mm/h
19.0mm in 1 hr to 02:00 19.0mm/h
20.8mm in 1 hr to 02:30 20.8mm/h
11.2mm in 1 hr to 07:30 11.2mm/h
CHARLES POINT AWS
8.6mm in 10 min to 01:10 51.6mm/h
15.0mm in 1 hr to 01:30 15.0mm/h
15.2mm in 1 hr to 02:00 15.2mm/h
7.0mm in 10 min to 04:00 42.0mm/h
9.2mm in 10 min to 04:10 55.2mm/h
23.6mm in 1 hr to 04:30 23.6mm/h
16.8mm in 1 hr to 05:00 16.8mm/h
10.0mm in 1 hr to 10:00 10.0mm/h
11.2mm in 1 hr to 10:30 11.2mm/h
11.0mm in 1 hr to 11:00 11.0mm/h
LEE POINT AWS
10.6mm in 1 hr to 07:30 10.6mm/h
DARWIN AIRPORT COMPARISON
19.0mm in 3 hr to 09:30 6.3mm/h
MCCLUER ISLAND
7.4mm in 19 min to 06:03 23.4mm/h
8.4mm in 49 min to 06:52 10.3mm/h
6.0mm in 8 min to 10:37 45.0mm/h
7.8mm in 16 min to 10:53 29.2mm/h
15.0mm in 3 hr to 12:30 5.0mm/h
DUM IN MIRRIE AWS
15.0mm in 3 hr to 03:30 5.0mm/h
CENTRE ISLAND
14.8mm in 52 min to 02:41 17.1mm/h
10.6mm in 10 min to 02:51 63.6mm/h
5.4mm in 3 min to 02:54 108.0mm/h
8.2mm in 7 min to 03:01 70.3mm/h
43.0mm in 3 hr to 03:30 14.3mm/h
109.2mm in 2 hr 58 min to 06:06 36.8mm/h
111.0mm in 3 hr to 06:30 37.0mm/h
BORROLOOLA
15.0mm in 3 hr to 09:30 5.0mm/h
CENTRAL ARNHEM PLATEAU
41.0mm in 3 hr to 06:30 13.7mm/h
PORT KEATS AERO
17.8mm in 1 hr to 15:30 17.8mm/h
18.0mm in 3 hr to 18:30 6.0mm/h
12.4mm in 1 hr to 22:30 12.4mm/h
SOUTH AUSTRALIA
NW Pastoral
TARCOOLA AERO
17.0mm in 3 hr to 12:30 5.7mm/h
QUEENSLAND
N Peninsula
WEIPA AERO
11.8mm in 30 min to 11:00 23.6mm/h
13.0mm in 1 hr to 11:00 13.0mm/h
17.0mm in 1 hr to 11:30 17.0mm/h
19.0mm in 3 hr to 12:00 6.3mm/h
COEN AIRPORT
11.6mm in 1 hr to 05:30 11.6mm/h
16.0mm in 3 hr to 06:00 5.3mm/h
15.2mm in 30 min to 06:30 30.4mm/h
16.8mm in 1 hr to 06:30 16.8mm/h
15.4mm in 30 min to 07:00 30.8mm/h
30.6mm in 1 hr to 07:00 30.6mm/h
10.6mm in 30 min to 07:30 21.2mm/h
26.0mm in 1 hr to 07:30 26.0mm/h
19.0mm in 1 hr to 08:00 19.0mm/h
13.4mm in 1 hr to 08:30 13.4mm/h
59.0mm in 3 hr to 09:00 19.7mm/h
S Peninsula
LOCKHART RIVER AIRPORT
21.8mm in 1 hr to 16:00 21.8mm/h
51.6mm in 1 hr to 17:00 51.6mm/h
42.2mm in 1 hr to 18:00 42.2mm/h
116.0mm in 3 hr to 18:00 38.7mm/h
21.2mm in 1 hr to 19:00 21.2mm/h
31.0mm in 3 hr to 21:00 10.3mm/h
147.0mm in * hr to 21:00 12.2mm/h
N Coast--Barron
CAPE FLATTERY
43.0mm in 3 hr to 00:00 14.3mm/h
NEW SOUTH WALES
Illawarra
MOSS VALE AWS
11.8mm in 1 hr to 16:00 11.8mm/h
South Coast
MONTAGUE ISLAND LIGHTHOUSE
16.0mm in 3 hr to 21:00 5.3mm/h
BRAIDWOOD RACECOURSE AWS
9.6mm in 23 min to 20:00 25.0mm/h
MERIMBULA AIRPORT AWS
19.8mm in 1 hr to 23:00 19.8mm/h
Goulburn/Monaro
CANBERRA AIRPORT
10.4mm in 1 hr to 19:30 10.4mm/h
18.0mm in 3 hr to 21:00 6.0mm/h
MOUNT GININI AWS
12.4mm in 30 min to 17:30 24.8mm/h
12.4mm in 1 hr to 17:30 12.4mm/h
VICTORIA
Upper NE
FALLS CREEK
15.0mm in 3 hr to 18:00 5.0mm/h
MT HOTHAM
17.0mm in 3 hr to 18:00 5.7mm/h

WESTERN AUSTRALIA
Goldfields
SOUTHERN CROSS AIRFIELD : 96(120/ 30 ) at 00:03
QUEENSLAND
Central Coast E
HAMILTON ISLAND AIRPORT : 74(100/ 63 ) at 00:00
NEW SOUTH WALES
South Coast
MONTAGUE ISLAND LIGHTHOUSE : 104(290/ 80 ) at 20:01
VICTORIA
Upper NE
MT HOTHAM : 91(***/ 65 ) at 18:56