Tuesday 23 MAY 2006

Home page

DWS ARCHIVE
2024 2023 2022 2021 2020 2019 2018 2017 2016 2015 2014 2013 2012 2011 2010 2009 2008 2007 2006 2005 2004 2003
Before 2003

About the DWS

2006

Dec

M Tu W Th F Sa Su
        01 02 03
04 05 06 07 08 09 10
11 12 13 14 15 16 17
18 19 20 21 22 23 24
25 26 27 28 29 30 31

Nov

M Tu W Th F Sa Su
    01 02 03 04 05
06 07 08 09 10 11 12
13 14 15 16 17 18 19
20 21 22 23 24 25 26
27 28 29 30      

Oct

M Tu W Th F Sa Su
            01
02 03 04 05 06 07 08
09 10 11 12 13 14 15
16 17 18 19 20 21 22
23 24 25 26 27 28 29
30 31          

Sept

M Tu W Th F Sa Su
        01 02 03
04 05 06 07 08 09 10
11 12 13 14 15 16 17
18 19 20 21 22 23 24
25 26 27 28 29 30  

August

M Tu W Th F Sa Su
  01 02 03 04 05 06
07 08 09 10 11 12 13
14 15 16 17 18 19 20
21 22 23 24 25 26 27
28 29 30 31      

July

M Tu W Th F Sa Su
          01 02
03 04 05 06 07 08 09
10 11 12 13 14 15 16
17 18 19 20 21 22 23
24 25 26 27 28 29 30
31            

June

M Tu W Th F Sa Su
      01 02 03 04
05 06 07 08 09 10 11
12 13 14 15 16 17 18
19 20 21 22 23 24 25
26 27 28 29 30    

May

M Tu W Th F Sa Su
01 02 03 04 05 06 07
08 09 10 11 12 13 14
15 16 17 18 19 20 21
22 23 24 25 26 27 28
29 30 31        

April

M Tu W Th F Sa Su
          01 02
03 04 05 06 07 08 09
10 11 12 13 14 15 16
17 18 19 20 21 22 23
24 25 26 27 28 29 30

March

M Tu W Th F Sa Su
    01 02 03 04 05
06 07 08 09 10 11 12
13 14 15 16 17 18 19
20 21 22 23 24 25 26
27 28 29 30 31    

February

M Tu W Th F Sa Su
    01 02 03 04 05
06 07 08 09 10 11 12
13 14 15 16 17 18 19
20 21 22 23 24 25 26
27 28          

January

M Tu W Th F Sa Su
            01
02 03 04 05 06 07 08
09 10 11 12 13 14 15
16 17 18 19 20 21 22
23 24 25 26 27 28 29
30 31          

Monthly summaries:
from BoM

Find a place:
Google Maps |
Aust Gazetteer|
Geonames

Weather terms:
WeatherZone | BoM |
American Met Soc | NOAA | uk.sci.weather | India Meteorological Department

National Daily Weather Summary

Records set | Charts | Cities | Hottest | Coldest | Rain, sun & wind | Downpours & gales
State extremes | Noteworthy weather | Capital Cities | Regional Cities | Alpine Stations
Charts and data courtesy Bureau of Meteorology. MTSAT-1R operated by JMA
Noteworthy weather today
significant newsworthy major

When reading these descriptions of today's weather events, please refer to the charts and tables for support and details. The descriptions serve to point out significant events and add information that is not available elsewhere on the page.

NSW, VIC, SA, QLD: Cold and wet in SE AUS

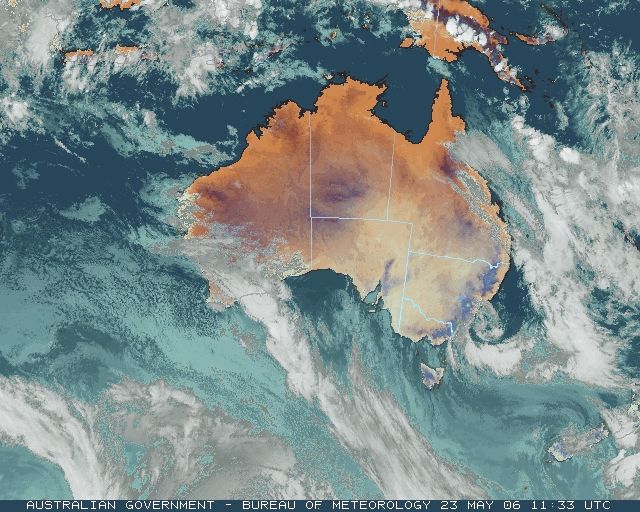
A low pressure system off the NSW coast combined with a cold, unstable airmass to produce record May rainfall on the South Coast and some of the lowest May daytime temperatures in decades. The satellite images below show cloud swirling around the low onto the South Coast, where rain began soon after 9am and continued without interruption into Wednesday morning. The heaviest falls were in a triangle bounded by Batemans Bay, Braidwood and Bega, where almost all gauges recorded between 50 and 125mm, Narooma topscoring with 124mm in the 24 hours to 9am Wednesday. Batemans Bay recorded 99mm, a May record, while the southerly airstream directed into the East Gippsland mountains produced a record 50.4mm May rainfall at Combienbar, 60km ENE of Orbost.

The wet day gave Moruya Heads its lowest May maximum temperature in 50 years, the mercury reaching just 12.0. Batemans Bay also recorded its coldest May day in 17 years with a top of 12.1. Strong to gale force winds around the low added to the perceived cold; Montague Island recorded a top gust of 104km/h this evening. Away from the coastal cloud, low humidity and the cold airmass produced a widespread cold night for May, with minima 6 to 10 below average across much of NSW, eastern SA and southern QLD. Screen minimum temperature records tumbled at Hawker SA and Armidale and Narranderra NSW, while Orange and Goondiwindi QLD had record low grass minimum temperatures. In southern SA, cloud moving in following the cold night put a lid on normal daytime temperature rises. Maxima were 6 to 8 below average with several new records being set. Whyalla's top of 12.1 knocked 1.4 off the previous 21-year extreme.

WA: Suspected tornado causes damage south of Perth

A vigorous cold front swept across SW WA this morning bringing heavy showers, thunderstorms and strong wind gusts. A strong downburst or possible tornado struck Port Kennedy, 40km S of Perth, about 8am, severely damaging two houses. Witnesses described objects "flying through the air", including an airconditioning unit which was blown from the roof of one of the houses onto a nearby road. Rockingham SES received at least 14 callouts for assistance and estimated property damage running into several hundred thousand dollars. The storms caused peak hour traffic delays in Perth and blacked out 2000 properties in Shenton Park, NW of the CBD.

NSW: Drought area expands

Sixty-two percent of NSW was officially declared in drought this week, 14% up on last month, with a further 28% marginal. Newly drought-declared areas include Condobolin, Forbes, the Central Tablelands, Young, Wagga, Gundagai, Braidwood and Bombala.


Records set or equalled today

These records are based on data received as at 1749 EST on 12/01/2007. Help in interpreting these statistics and information on quality control is here.

District Site Today Previous monthly record Previous all time record
if equalled or broken
Comments
Reading Reading Date Years Reading Date Years
Lowest grass minimum temperature

QLD

Darling Downs E

041521

GOONDIWINDI AIRPORT

-5.1

-3.6

21/05/1994

15

NSW

C Tablelands S

063254

ORANGE AGRICULTURAL INSTITUTE

-8.0

-8.0

11/05/1979

31

Equal to record.

Lowest minimum temperature

SA

Upper North

019017

HAWKER

-1.7

-1.5

28/05/1987

39

NSW

N Tablelands W

056238

ARMIDALE AIRPORT AWS

-4.8

-4.0

31/05/2004

12

NSW

Riverina E

074221

NARRANDERA GOLF CLUB

-2.5

-2.5

17/05/1999

37

Equal to record.

Lowest maximum temperature

SA

W Agricultural

018120

WHYALLA AERO

12.1

13.5

27/05/1987

21

SA

Yorke Peninsula

022046

EDITHBURGH

13.2

14.1

26/05/2000

12

SA

Kangaroo Is

022841

KINGSCOTE AERO

14.0

14.1

30/05/2000

12

SA

Mt Lofty Ranges

023842

MOUNT LOFTY

5.0

6.4

19/05/2001

13

SA

Mt Lofty Ranges

023875

PARAWA (SECOND VALLEY FOREST AWS)

10.0

10.0

13/05/1997

12

Equal to record.

SA

Mt Lofty Ranges

023878

MOUNT CRAWFORD FIRE TOWER

6.7

8.6

24/05/1999

12

NSW

South Coast

069018

MORUYA HEADS PILOT STATION

12.0

12.2

28/05/1962

50

NSW

South Coast

069134

BATEMANS BAY (CATALINA COUNTRY CLUB)

12.1

12.8

28/05/2000

15


The day in charts
Surface charts Satellite images Rain & temperatures
4am EST Rainfall -- 24 hours to 9am
Available about 6am EST Available about 4am EST Available about 2pm EST
Week to 9am | SE AUS detail
10am EST Minimum temperature +/- normal
Available about noon EST Available about 10am EST Available about 2pm EST next day
Actual temperatures
4pm EST Maximum temperature +/- normal
Available about 6pm EST Available about 4pm EST Available about 2pm EST next day
Actual temperatures
10pm EST Solar Radiation
Available about midnight EST Available about 10pm EST Available about 2am EST next day

Summary of observations

For notes on how to interpret the data and quality control issues, see Daily Weather Summary Help.
**S** and **W** precede data flagged by the Bureau as suspicious or wrong
Data is as received at 22:44EST, 14/05/2012.

Major centres
Max
° C
+/- norm
° C
Min
° C
+/- norm
° C
Grass Min
° C
Rain to 9am mm Evaporation to 9am mm Sunshine hours Wind Run to 9am km (24-hour average km/h) Maximum Gust km/h / hour of occurrence
GERALDTON AIRPORT 22.4 -1.6 15.4 +2.5 14.6 0.0 8.0 -- 472 (19.7) 46/23
PERTH AIRPORT 21.8 +0.1 14.0 +3.5 11.9 11.2 3.8 0.3 353 (14.7) 39/02
ALBANY AIRPORT 20.2 +1.3 11.4 +1.6 9.4 1.0 3.4 3.5 375 (15.6) 45/19
BUNBURY 20.2 -0.9 17.5 +8.0 -- 1.2 -- -- 347 (14.5) 44/14
MANDURAH 19.7 -- 18.4 -- -- 0.0 -- -- 477 (19.9) 43/06
DARWIN AIRPORT 32.1 +0.1 23.6 +1.5 22.6 0.0 5.4 10.6 272 (11.3) 37/12
ALICE SPRINGS AIRPORT 18.5 -4.5 4.2 -4.1 1.2 0.0 4.0 10.4 327 (13.6) 32/10
WHYALLA AERO 12.1 -8.4 4.2 -4.5 -- 0.0 3.4 -- 244 (10.2) 28/09
ADELAIDE (KENT TOWN) 12.7 -6.3 9.7 -0.5 9.4 0.0 1.6 1.6 210 ( 8.8) 24/10
MOUNT GAMBIER AERO 10.6 -5.5 6.2 -1.1 4.9 0.4 0.4 0.4 178 ( 7.4) 17/05
MOUNT ISA AERO 24.2 -3.7 15.1 +1.2 13.5 0.4 6.0 7.7 385 (16.0) 35/01
CAIRNS AERO 27.9 +0.3 21.2 +1.3 19.3 0.0 4.4 8.6 445 (18.5) 32/12
TOWNSVILLE AERO 26.5 -1.1 18.2 +0.6 16.0 1.8 2.6 4.5 250 (10.4) 26/19
MACKAY M.O 21.3 -2.9 18.6 +1.5 -- 6.2 -- 0.8 511 (21.3) 39/07
ROCKHAMPTON AERO 19.5 -6.5 16.2 +2.0 15.8 10.8 1.4 -- -- 21/11
BUNDABERG AERO 19.6 -5.1 16.8 +2.6 -- 0.0 4.0 -- 258 (10.8) 26/10
NAMBOUR DPI 20.8 -2.9 13.5 +1.5 -- 0.3 2.1 -- -- --
COOLANGATTA 21.7 -1.4 14.4 +0.1 -- 0.0 -- -- 219 ( 9.1) 28/09
BRISBANE AERO 22.9 -0.7 14.1 +1.3 12.0 0.8 3.6 6.0 237 ( 9.9) 26/13
TOOWOOMBA AIRPORT 17.3 -2.7 7.8 -2.2 -- 11.0 -- -- 272 (11.3) 37/12
GUNNEDAH (DIPNR) 16.8 -3.5 0.9 -7.8 -2.9 0.0 2.6 -- 142 ( 5.9) --
COFFS HARBOUR MO 18.4 -3.0 11.5 -0.2 7.7 0.0 1.6 10.0 293 (12.2) 32/06
PORT MACQUARIE AIRPORT AWS 19.7 -1.8 7.0 -3.5 -- 0.8 -- -- -- --
WILLIAMTOWN RAAF 17.4 -2.8 7.2 -2.9 5.7 8.8 3.8 9.2 405 (16.9) 35/12
GOSFORD (NARARA RESEARCH STATION) AWS 16.2 -4.2 8.2 -0.1 6.3 18.8 -- -- 181 ( 7.5) 28/10
ORANGE AGRICULTURAL INSTITUTE 9.0 -5.2 -1.3 -6.0 -8.0 0.0 4.0 8.5 -- --
DUBBO AIRPORT AWS 16.0 -4.0 -0.4 -7.2 -- 0.0 -- -- -- --
SYDNEY AIRPORT AMO 15.8 -4.2 8.8 -2.1 6.8 1.2 4.2 0.6 653 (27.2) 58/18
RICHMOND RAAF 16.6 -4.0 3.6 -4.3 -- 1.4 -- -- 175 ( 7.3) 39/18
BELLAMBI AWS 15.7 -4.0 10.3 -2.8 -- 0.0 -- -- 566 (23.6) 61/16
CANBERRA AIRPORT 12.2 -3.4 1.2 -2.0 -3.6 0.0 2.6 3.4 248 (10.3) 54/12
WAGGA WAGGA AMO 16.0 -1.3 -2.4 -8.3 -4.3 0.0 1.4 9.6 166 ( 6.9) 35/14
ALBURY AIRPORT AWS 15.6 -2.1 -1.7 -7.3 -- 0.0 -- -- 88 ( 3.7) 30/13
MILDURA AIRPORT 13.8 -5.2 4.2 -3.2 1.9 0.0 2.2 7.2 280 (11.7) 32/12
TATURA INST SUSTAINABLE AG 15.7 -1.6 3.9 -1.9 -- 0.0 2.1 -- 393 (16.4) 35/11
BENDIGO AIRPORT 13.9 -2.7 -2.3 -7.5 -- 0.0 -- -- 260 (10.8) 39/13
MELBOURNE REGIONAL OFFICE 14.2 -2.5 4.5 -4.1 2.6 1.4 1.0 -- 58 ( 2.4) 18/13
GEELONG AIRPORT 13.8 -3.3 3.5 -4.2 -- 0.0 -- -- 229 ( 9.5) 30/14
BALLARAT AERODROME 10.8 -2.8 2.2 -3.5 -- 0.0 -- -- 451 (18.8) 35/23
LAUNCESTON (TI TREE BEND) 13.6 -2.2 4.6 -0.5 -- 0.0 -- -- 286 (11.9) 24/10
HOBART AIRPORT 12.8 -2.4 4.2 -2.4 2.6 0.0 1.0 7.4 -- 22/05
Max
° C
+/- norm
° C
Min
° C
+/- norm
° C
Grass Min
° C
Rain to 9am mm Evaporation to 9am mm Sunshine hours Wind Run to 9am km Maximum Gust km/h / hour of occurrence
Hottest
Highest maximum temperature>Greatest variation above normal maximum Highest minimum temperatureGreatest variation above normal minimum

33.9 BIDYADANGA W Kimberley WA
33.6 JABIRU AIRPORT N Rivers NT
33.1 KALUMBURU N Kimberley WA
33.1 MANDORA E Pilbara WA
33.0 MANINGRIDA AERO N Rivers NT

+5.7 : 26.6 BALLADONIA Eucla WA
+5.5 : 25.2 SALMON GUMS RES.STN. Goldfields WA
+5.2 : 26.5 EYRE Eucla WA
+5.2 : 25.8 KALGOORLIE-BOULDER AIRPORT Goldfields WA
+5.0 : 25.3 ESPERANCE AERO Lower West WA

26.2 COCONUT ISLAND N Peninsula QLD
26.0 NORTHERN ENDEAVOUR Islands ISL
25.6 MCCLUER ISLAND N Rivers NT
25.5 COCOS ISLAND AIRPORT Islands ISL
25.1 HORN ISLAND N Peninsula QLD

+8.0 : 17.5 BUNBURY Lower West WA
+7.8 : 16.0 DONNYBROOK Lower West WA
+7.6 : 14.5 JARRAHWOOD Lower West WA
+7.6 : 15.8 NAREMBEEN Cent Wheatbelt WA
+7.5 : 14.0 WANDERING Cent Wheatbelt WA

Coldest
Lowest maximum temperatureGreatest variation below normal maximum Lowest minimum temperatureGreatest variation below normal minimum

-0.3 MT HOTHAM Upper NE VIC
0.0 THREDBO AWS Snowy Mtns NSW
0.5 FALLS CREEK Upper NE VIC
1.5 MT BAW BAW W Gippsland VIC
1.6 PERISHER VALLEY SKI CENTRE Snowy Mtns NSW

-16.5 : 6.9 MARREE AERO NE Pastoral SA
-8.6 : 8.8 NURIOOTPA VITICULTURAL Adelaide/Lofty SA
-8.6 : 10.9 LOXTON RESEARCH CENTRE Murray Valley SA
-8.4 : 12.1 WHYALLA AERO W Agricultural SA
-8.3 : 11.7 RENMARK AERO Murray Valley SA

-7.2 GOULBURN AIRPORT AWS Goulburn/Monaro NSW
-6.7 GLEN INNES AIRPORT AWS N Tablelands W NSW
-6.5 ARMIDALE (TREE GROUP NURSERY) N Tablelands W NSW
-6.5 WOOLBROOK (DANGLEMAH ROAD) NW Slopes S NSW
-5.9 BARRABA POST OFFICE NW Slopes N NSW

-10.4 : -7.2 GOULBURN AIRPORT AWS Goulburn/Monaro NSW
-10.2 : -5.9 BARRABA POST OFFICE NW Slopes N NSW
-9.3 : -2.5 NARRANDERA GOLF CLUB Riverina E NSW
-9.2 : -1.6 INVERELL RESEARCH CENTRE N Tablelands W NSW
-9.2 : -4.8 ARMIDALE AIRPORT AWS N Tablelands W NSW
-9.2 : -4.5 GLEN INNES AG RESEARCH STN N Tablelands W NSW

Wettest
Sunniest & dullest
Windiest
Highest gusts
Todays highest rainfall totals for the 24 hours to 9am. It includes the top 5 totals nationally followed by all reported falls of 50mm or more.
Highest and lowest recordings of hours of sunshine for the 24 hours to midnight.
Highest wind run totals in kilometres for the 24 hours to 9am (average speed in brackets). All reported runs > =25km/h are shown.
Highest wind gusts in km/h for the 24 hours to midnight followed by the hour in which it occurred. All stations with gusts > 89km/h are shown.
64.0 CRAIGIE (BONDI FOREST LODGE) Goulburn/Monaro NSW
61.0 COLLAROY (LONG REEF GOLF CLUB) Sydney--east NSW
49.4 HOPELANDS Lower West WA
47.8 RUDDS LANE TM Brisbane/SE Coast QLD
46.1 CATHCART (MOUNT DARRAGH) South Coast NSW

WESTERN AUSTRALIA
Lower West
49.4 HOPELANDS

QUEENSLAND
Brisbane/SE Coast
47.8 RUDDS LANE TM

NEW SOUTH WALES
Sydney--east
61.0 COLLAROY (LONG REEF GOLF CLUB)
South Coast
46.1 CATHCART (MOUNT DARRAGH)
Goulburn/Monaro
64.0 CRAIGIE (BONDI FOREST LODGE)

10.8 BROOME AIRPORT W Kimberley WA
10.6 DARWIN AIRPORT N Rivers NT
10.6 RABBIT FLAT N Plateau NT
10.5 GILES METEOROLOGICAL OFFICE Interior WA
10.5 TENNANT CREEK AIRPORT N Plateau NT

.....

0.8 NURIOOTPA VITICULTURAL Adelaide/Lofty SA
0.8 MACKAY M.O Central Coast E QLD
0.6 SYDNEY AIRPORT AMO Sydney--east NSW
0.4 MOUNT GAMBIER AERO Lower SE SA
0.3 PERTH AIRPORT Lower West WA
0.2 ADELAIDE AIRPORT Adelaide/Lofty SA

1080 (45.0) EDDYSTONE POINT E Coast TAS
812 (33.8) GREEN CAPE AWS South Coast NSW
794 (33.1) MOUNT BULLER Upper NE VIC
783 (32.6) VARANUS ISLAND Islands ISL
758 (31.6) CAPE LEEUWIN Lower West WA
752 (31.3) CAPE FLATTERY N Coast--Barron QLD
750 (31.3) LOW HEAD N Coast TAS
744 (31.0) HAMILTON ISLAND AIRPORT Central Coast E QLD
697 (29.0) CAPE NATURALISTE Lower West WA
688 (28.7) LOW ISLES LIGHTHOUSE N Coast--Barron QLD
653 (27.2) SYDNEY AIRPORT AMO Sydney--east NSW
643 (26.8) MT HOTHAM Upper NE VIC
621 (25.9) ESPERANCE Lower West WA
613 (25.5) MCCLUER ISLAND N Rivers NT
612 (25.5) BARROW ISLAND AIRPORT W Pilbara WA
606 (25.3) CHEADANUP Goldfields WA
605 (25.2) HOGAN ISLAND Islands ISL
78/23 GREEN CAPE AWS South Coast NSW
74/13 CHEADANUP Goldfields WA
72/08 BLACKALL AIRPORT Central West QLD
71/08 MOUNT BULLER Upper NE VIC
68/17 SOUTHERN CROSS AIRFIELD Goldfields WA
68/16 THREDBO AWS Snowy Mtns NSW

Downpours High AWS wind reports
High rainfall for periods of 6 hours or less from AWS and synoptic reports. Storm force gusts (>89km/h) and 10-minute mean gales (>62km/h) reported by AWSs. Wind direction and mean windspeed are shown in brackets.
WESTERN AUSTRALIA
Lower West
PERTH AIRPORT
7.2mm in 18 min to 03:00 24.0mm/h
JANDAKOT AERO
11.0mm in 1 hr to 10:00 11.0mm/h
15.0mm in 3 hr to 12:00 5.0mm/h
SHANNON
10.0mm in 1 hr to 20:00 10.0mm/h
NORTH WALPOLE
12.0mm in 1 hr to 04:00 12.0mm/h
16.0mm in 3 hr to 06:00 5.3mm/h
QUEENSLAND
Wide Bay/Burnett
HERON ISLAND RES STN
12.0mm in 1 hr to 07:00 12.0mm/h
24.0mm in 3 hr to 09:00 8.0mm/h
NEW SOUTH WALES
Illawarra
JERVIS BAY (PT PERPENDICULAR AWS)
18.0mm in 3 hr to 18:00 6.0mm/h
South Coast
MONTAGUE ISLAND LIGHTHOUSE
20.0mm in 3 hr to 15:00 6.7mm/h
18.0mm in 3 hr to 21:00 6.0mm/h
MORUYA AIRPORT AWS
18.0mm in 3 hr to 21:00 6.0mm/h
VICTORIA
E Gippsland
GABO ISLAND LIGHTHOUSE
44.0mm in 6 hr to 15:00 7.3mm/h
MALLACOOTA
11.0mm in 30 min to 12:00 22.0mm/h
17.4mm in 1 hr to 12:00 17.4mm/h
23.0mm in 3 hr to 12:00 7.7mm/h
12.8mm in 1 hr to 12:30 12.8mm/h
COMBIENBAR AWS
16.0mm in 3 hr to 15:00 5.3mm/h
MT NOWA NOWA
16.0mm in 3 hr to 00:00 5.3mm/h
ISLANDS
Islands
CHRISTMAS ISLAND AERO
20.0mm in 3 hr to 07:00 6.7mm/h
22.0mm in 3 hr to 10:00 7.3mm/h

NEW SOUTH WALES
South Coast
MONTAGUE ISLAND LIGHTHOUSE : 104(180/ 69 ) at 21:38