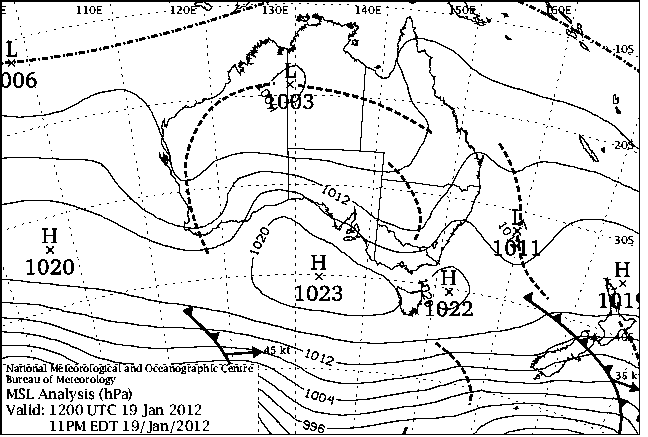
|
For notes on how to interpret
the data and quality control issues, see Daily Weather Summary Help.
**S** and **W** precede data flagged by the Bureau as suspicious or wrong
Data is as received at 00:48EST, 07/06/2012.
|
|
| |
Max
°
C |
+/- norm
°
C |
Min
°
C |
+/- norm
°
C |
Grass Min
°
C |
Rain to 9am mm |
Evaporation to 9am mm |
Sunshine hours |
Wind Run to 9am km (24-hour average km/h) |
Maximum Gust km/h / hour of occurrence |
| GERALDTON AIRPORT COMPARISON |
33.5 |
+1.9 |
24.6 |
+6.3 |
-- |
0.0 |
-- |
-- |
490 (20.4) |
52/15 |
| PERTH AIRPORT |
35.5 |
+3.8 |
20.1 |
+3.1 |
17.9 |
0.0 |
11.2 |
11.1 |
366 (15.3) |
35/13 |
| ALBANY AIRPORT |
28.3 |
+3.6 |
16.1 |
+2.4 |
15.0 |
0.0 |
-- |
-- |
428 (17.8) |
-- |
| BUNBURY |
31.5 |
+1.9 |
21.9 |
+6.7 |
-- |
0.0 |
-- |
-- |
320 (13.3) |
34/16 |
| MANDURAH |
29.8 |
+0.8 |
22.3 |
+3.7 |
-- |
0.0 |
-- |
-- |
288 (12.0) |
34/16 |
| DARWIN AIRPORT |
31.1 |
-0.7 |
24.0 |
-0.8 |
25.4 |
1.0 |
3.4 |
2.3 |
276 (11.5) |
30/07 |
| ALICE SPRINGS AIRPORT |
41.2 |
+4.8 |
19.6 |
-1.9 |
18.7 |
0.0 |
16.6 |
12.1 |
355 (14.8) |
46/12 |
| WHYALLA AERO |
30.3 |
+0.3 |
19.0 |
+1.5 |
-- |
0.0 |
10.6 |
-- |
668 (27.8) |
57/17 |
| ADELAIDE (KENT TOWN) |
32.3 |
+3.1 |
16.0 |
-1.1 |
12.6 |
0.0 |
8.0 |
12.5 |
269 (11.2) |
43/15 |
| MOUNT GAMBIER AERO |
25.1 |
-0.1 |
9.2 |
-1.9 |
5.3 |
0.0 |
4.8 |
12.6 |
396 (16.5) |
43/14 |
| MOUNT ISA AERO |
38.2 |
+2.0 |
21.9 |
-1.8 |
20.2 |
0.0 |
10.4 |
-- |
261 (10.9) |
37/13 |
| CAIRNS AERO |
31.4 |
0.0 |
23.3 |
-0.4 |
23.3 |
39.4 |
5.6 |
4.7 |
274 (11.4) |
30/06 |
| TOWNSVILLE AERO |
30.3 |
-1.0 |
23.3 |
-1.0 |
23.1 |
13.8 |
4.8 |
4.0 |
344 (14.3) |
35/05 |
| MACKAY M.O |
29.9 |
-0.1 |
23.8 |
+0.3 |
-- |
0.0 |
-- |
9.3 |
258 (10.8) |
24/10 |
| ROCKHAMPTON AERO |
35.5 |
+3.6 |
23.3 |
+1.2 |
22.2 |
0.0 |
6.8 |
-- |
193 ( 8.0) |
31/17 |
| BUNDABERG AERO |
31.4 |
+1.3 |
21.9 |
+0.5 |
-- |
0.0 |
-- |
-- |
275 (11.5) |
43/16 |
| NAMBOUR DPI |
29.0 |
-0.3 |
21.0 |
+1.6 |
-- |
1.0 |
-- |
-- |
-- |
-- |
| COOLANGATTA |
29.6 |
+1.3 |
19.7 |
-1.3 |
-- |
1.8 |
-- |
-- |
250 (10.4) |
52/16 |
| BRISBANE AERO |
29.4 |
+0.4 |
20.1 |
-1.1 |
19.0 |
0.0 |
5.0 |
12.3 |
293 (12.2) |
44/18 |
| TOOWOOMBA AIRPORT |
29.0 |
+0.9 |
18.1 |
+0.6 |
-- |
1.6 |
-- |
-- |
473 (19.7) |
46/18 |
| GUNNEDAH RESOURCE CENTRE |
33.3 |
+1.4 |
17.7 |
-1.2 |
13.1 |
0.0 |
8.2 |
-- |
184 ( 7.7) |
-- |
| COFFS HARBOUR MO |
27.7 |
+0.8 |
21.0 |
+1.6 |
19.6 |
0.0 |
7.0 |
11.3 |
362 (15.1) |
37/20 |
| PORT MACQUARIE AIRPORT AWS |
28.8 |
+1.2 |
18.8 |
+0.6 |
-- |
0.0 |
-- |
-- |
233 ( 9.7) |
46/14 |
| WILLIAMTOWN RAAF |
28.0 |
0.0 |
16.8 |
-1.2 |
13.8 |
0.2 |
-- |
-- |
267 (11.1) |
39/10 |
| GOSFORD (NARARA RESEARCH STATION) AWS |
26.6 |
-1.0 |
17.1 |
+0.3 |
-- |
0.0 |
-- |
-- |
41 ( 1.7) |
50/19 |
| ORANGE AGRICULTURAL INSTITUTE |
28.7 |
+2.2 |
14.5 |
+1.2 |
8.2 |
0.0 |
7.0 |
12.6 |
-- |
-- |
| DUBBO AIRPORT AWS |
34.2 |
+1.1 |
18.6 |
+0.5 |
-- |
0.0 |
-- |
-- |
224 ( 9.3) |
-- |
| SYDNEY AIRPORT AMO |
24.9 |
-1.5 |
21.3 |
+2.5 |
18.5 |
0.0 |
7.8 |
-- |
371 (15.5) |
48/11 |
| RICHMOND RAAF |
29.3 |
-0.6 |
18.5 |
+0.9 |
-- |
0.0 |
-- |
-- |
106 ( 4.4) |
31/15 |
| BELLAMBI AWS |
24.0 |
-0.9 |
19.7 |
+0.7 |
-- |
0.0 |
-- |
-- |
301 (12.5) |
48/08 |
| CANBERRA AIRPORT |
31.0 |
+3.0 |
13.0 |
-0.2 |
-- |
0.0 |
-- |
-- |
-- |
-- |
| WAGGA WAGGA AMO |
36.1 |
+4.5 |
16.8 |
+0.6 |
14.1 |
0.0 |
8.0 |
13.4 |
254 (10.6) |
44/22 |
| ALBURY AIRPORT AWS |
36.1 |
+3.9 |
17.8 |
+1.1 |
-- |
0.4 |
-- |
-- |
89 ( 3.7) |
28/13 |
| MILDURA AIRPORT |
36.5 |
+4.3 |
18.7 |
+2.0 |
17.6 |
0.0 |
12.4 |
12.9 |
419 (17.5) |
35/16 |
| TATURA INST SUSTAINABLE AG |
32.6 |
+3.1 |
14.8 |
+0.7 |
-- |
3.2 |
5.6 |
-- |
370 (15.4) |
37/18 |
| BENDIGO AIRPORT |
33.0 |
+3.4 |
14.7 |
+0.7 |
-- |
0.2 |
-- |
-- |
447 (18.6) |
�
39/18 |
| MELBOURNE REGIONAL OFFICE |
24.0 |
-1.9 |
15.6 |
+1.3 |
-- |
0.0 |
18.6 |
-- |
-- |
-- |
| BALLARAT AERODROME |
26.7 |
+1.7 |
11.1 |
+0.3 |
-- |
0.0 |
-- |
-- |
597 (24.9) |
50/21 |
| LAUNCESTON (TI TREE BEND) |
25.6 |
+1.3 |
14.0 |
+1.8 |
-- |
0.0 |
-- |
-- |
254 (10.6) |
35/14 |
| HOBART AIRPORT |
22.4 |
-0.1 |
10.7 |
-1.3 |
6.6 |
0.4 |
6.0 |
12.7 |
440 (18.3) |
39/12 |
| |
Max
°
C |
+/- norm
°
C |
Min
°
C |
+/- norm
°
C |
Grass Min
°
C |
Rain to 9am mm |
Evaporation to 9am mm |
Sunshine hours |
Wind Run to 9am km |
Maximum Gust km/h / hour of occurrence |
|
| Hottest |
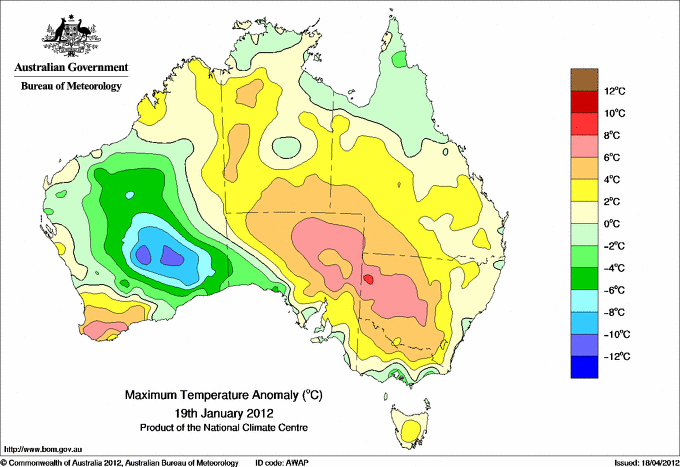
| Highest maximum temperature> | Greatest variation above normal maximum |
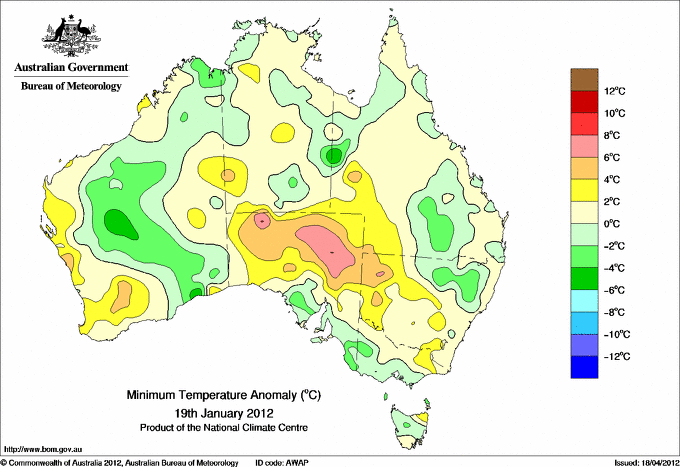
Highest minimum temperature | Greatest variation above normal minimum |
43.9 MOOMBA AIRPORT NE Pastoral SA
43.8 MARREE COMPARISON NE Pastoral SA
43.7 OODNADATTA AIRPORT NE Pastoral SA
43.6 BIRDSVILLE AIRPORT Channel Country QLD
43.2 RABBIT FLAT N Plateau NT
|
+8.5 : 34.6 PEMBERTON Lower West WA
+8.3 : 35.4 MANJIMUP Lower West WA
+8.3 : 37.7 JARRAHWOOD Lower West WA
+7.4 : 34.6 ROCKY GULLY Lower West WA
+7.2 : 36.9 BRIDGETOWN Lower West WA
+7.2 : 35.8 ONGERUP Cent Wheatbelt WA
|
30.0 NORTHERN ENDEAVOUR Islands ISL
29.1 BOULIA AIRPORT Channel Country QLD
28.9 OODNADATTA AIRPORT NE Pastoral SA
28.7 BROOME AIRPORT W Kimberley WA
28.7 MARREE AERO NE Pastoral SA
|
+7.2 : 28.6 MARREE COMPARISON NE Pastoral SA
+6.7 : 21.9 BUNBURY Lower West WA
+6.3 : 24.6 GERALDTON AIRPORT COMPARISON Central West WA
+5.9 : 28.9 OODNADATTA AIRPORT NE Pastoral SA
+5.7 : 19.6 DONNYBROOK Lower West WA
+5.7 : 28.7 MARREE AERO NE Pastoral SA
|
| Coldest |
| Lowest maximum temperature | Greatest variation below normal maximum |
Lowest minimum temperature | Greatest variation below normal minimum |
14.9 MOUNT READ W Coast TAS
15.4 MOUNT WELLINGTON Southeast TAS
15.5 MAATSUYKER ISLAND LIGHTHOUSE Southeast TAS
18.0 CAPE GRIM COMPARISON N Coast TAS
18.1 WEEAPROINAH W Coast VIC
|
-10.8 : 26.2 LEONORA Goldfields WA
-9.4 : 26.1 LAVERTON AERO Goldfields WA
-8.5 : 24.5 BALGAIR Eucla WA
-7.8 : 29.6 LEINSTER AERO Goldfields WA
-6.4 : 32.5 CARNEGIE Interior WA
|
1.2 LIAWENEE Central Plateau TAS
3.2 LAKE ST CLAIR NATIONAL PARK Central Plateau TAS
3.8 CHARLOTTE PASS (KOSCIUSKO CHALET) Snowy Mtns NSW
4.1 MOUNT WELLINGTON Southeast TAS
4.6 MOUNT READ W Coast TAS
|
-5.7 : 10.0 POINT HICKS (LIGHTHOUSE) E Gippsland VIC
-5.7 : 5.4 MORTLAKE RACECOURSE W Coast VIC
-5.2 : 10.1 EYRE Eucla WA
-5.0 : 19.0 URANDANGI Northwest QLD
-4.6 : 16.3 ROMA AIRPORT Maranoa QLD
|
|
Sunniest &
dullest |
Windiest |
Highest gusts |
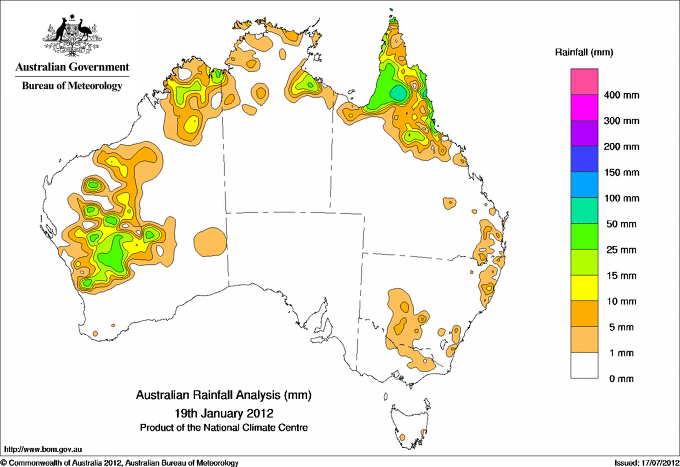
Todays highest rainfall totals for the 24 hours to 9am. It
includes the top 5 totals nationally followed by all reported falls of 50mm or more. |
Highest
and lowest recordings of hours of sunshine for the 24 hours to midnight. |
Highest wind
run totals in kilometres for the 24 hours to 9am (average speed in brackets).
All reported runs >
=25km/h are shown. |
Highest wind
gusts in km/h for the 24 hours to midnight followed by the hour in which it occurred.
All stations with gusts >
89km/h are shown. |
174.0 LORD HOWE ISLAND (ORLANDO) Islands ISL
164.0 LORD HOWE ISLAND (MILKY WAY) Islands ISL
141.0 LORD HOWE ISLAND AERO Islands ISL
139.0 LORD HOWE ISLAND (MIDDLE BEACH) Islands ISL
136.0 MOSSMAN CENTRAL MILL N Coast--Barron QLD
WESTERN AUSTRALIA
E Kimberley
50.2 KUNUNURRA AERO
E Gascoyne
50.0 MADOONGA
Central West
60.6 BERKSHIRE VALLEY
QUEENSLAND
N Peninsula
75.2 AURUKUN SHIRE COUNCIL
69.0 HORN ISLAND
67.2 HIGHBURY STATION
52.6 PUNSAND BAY
S Peninsula
82.0 GAMBOOLA STATION
N Coast--Barron
136.0 MOSSMAN CENTRAL MILL
123.4 WHYANBEEL VALLEY
123.0 DAINTREE TEA
114.0 MOSSMAN SOUTH ALCHERA DRIVE
93.0 DAINTREE ICE CREAM
88.2 LOW ISLES LIGHTHOUSE
77.6 CAPE TRIBULATION STORE
72.0 HAPPY VALLEY
68.0 BELLENDEN KER BOTTOM STN
55.0 PORT DOUGLAS - WARNER ST
54.0 CAIRNS SEVERIN ST
53.8 CAPE FLATTERY
53.0 PARRAMATTA PARK
50.0 BABINDA POST OFFICE
N Coast--Herbert
134.0 LUCINDA TOWNSHIP
84.4 BAMBAROO
78.0 HALIFAX ALERT
75.0 HALIFAX MACROSSAN ST
73.0 ROLLINGSTONE
70.0 DUNK ISLAND RESORT
66.5 BINGIL BAY
NEW SOUTH WALES
MidNorth Coast N
50.0 BOWRAVILLE RECREATION CLUB
ISLANDS
Islands
174.0 LORD HOWE ISLAND (ORLANDO)
164.0 LORD HOWE ISLAND (MILKY WAY)
141.0 LORD HOWE ISLAND AERO
139.0 LORD HOWE ISLAND (MIDDLE BEACH)
|
14.0 LIAWENEE Central Plateau TAS
13.8 ADELAIDE AIRPORT Adelaide/Lofty SA
13.4 NURIOOTPA VITICULTURAL Adelaide/Lofty SA
13.4 WAGGA WAGGA AMO SW Slopes S NSW
13.4 EAST SALE AIRPORT W Gippsland VIC
.....
4.9 WEIPA AERO N Peninsula QLD
4.7 CAIRNS AERO N Coast--Barron QLD
4.0 TOWNSVILLE AERO N Coast--Herbert QLD
2.3 DARWIN AIRPORT N Rivers NT
0.8 WALKAMIN RESEARCH STATION N Coast--Barron QLD
|
1233 (51.4) MAATSUYKER ISLAND LIGHTHOUSE Southeast TAS
1005 (41.9) HOGAN ISLAND Islands ISL
957 (39.9) CAPE GRIM BAPS (COMPARISON) N Coast TAS
803 (33.5) NEPTUNE ISLAND W Agricultural SA
796 (33.2) CAPE LEEUWIN Lower West WA
777 (32.4) CAPE WILLOUGHBY Yorke Pen/Kanga Is SA
752 (31.3) LORD HOWE ISLAND AERO Islands ISL
726 (30.3) PARAWA (SECOND VALLEY FOREST AWS) Adelaide/Lofty SA
717 (29.9) EDITHBURGH Yorke Pen/Kanga Is SA
714 (29.8) HARTZ MOUNTAIN (KEOGHS PIMPLE) Southeast TAS
702 (29.3) DOUBLE ISLAND POINT LIGHTHOUSE Brisbane/SE Coast QLD
692 (28.8) MOUNT CRAWFORD (MT CRAWFORD AWS) Adelaide/Lofty SA
683 (28.5) CAPE BRUNY (CAPE BRUNY) Southeast TAS
668 (27.8) WHYALLA AERO W Agricultural SA
657 (27.4) RED ROCKS POINT Eucla WA
655 (27.3) STENHOUSE BAY Yorke Pen/Kanga Is SA
645 (26.9) CAPE JAFFA (THE LIMESTONE) Lower SE SA
642 (26.8) MOUNT WELLINGTON Southeast TAS
640 (26.7) MINLATON AERO Yorke Pen/Kanga Is SA
629 (26.2) TASMAN ISLAND Southeast TAS
620 (25.8) NORTH SHIELDS (PORT LINCOLN AWS) W Agricultural SA
618 (25.8) NORFOLK ISLAND AERO Islands ISL
612 (25.5) PORT AUGUSTA AERO W Agricultural SA
603 (25.1) NULLARBOR W Agricultural SA
|
81/21 VICTORIA RIVER DOWNS N Rivers NT
81/17 AMBERLEY AMO Brisbane/SE Coast QLD
72/04 LORD HOWE ISLAND AERO Islands ISL
67/16 TRANGIE RESEARCH STATION AWS CW Plains N NSW
67/17 MAATSUYKER ISLAND LIGHTHOUSE Southeast TAS
|
�