|
For notes on how to interpret
the data and quality control issues, see Daily Weather Summary Help.
**S** and **W** precede data flagged by the Bureau as suspicious or wrong
Data is as received at 23:20EST, 19/04/2013.
|
|
| |
Max
°
C |
+/- norm
°
C |
Min
°
C |
+/- norm
°
C |
Grass Min
°
C |
Rain to 9am mm |
Evaporation to 9am mm |
Sunshine hours |
Wind Run to 9am km (24-hour average km/h) |
Maximum Gust km/h / hour of occurrence |
| GERALDTON AIRPORT COMPARISON |
-- |
-- |
10.6 |
-2.3 |
-- |
0.0 |
-- |
-- |
290 (12.1) |
-- |
| PERTH AIRPORT |
25.8 |
+4.1 |
8.4 |
-2.0 |
6.2 |
0.0 |
3.2 |
9.3 |
267 (11.1) |
37/16 |
| ALBANY AIRPORT COMPARISON |
19.1 |
+0.1 |
11.0 |
+1.2 |
-- |
0.4 |
-- |
-- |
176 ( 7.3) |
31/15 |
| BUNBURY |
22.2 |
+1.1 |
5.2 |
-4.2 |
-- |
0.2 |
-- |
-- |
-- |
-- |
| MANDURAH |
22.5 |
+1.2 |
12.6 |
-1.0 |
-- |
0.0 |
-- |
-- |
251 (10.5) |
26/23 |
| DARWIN AIRPORT |
32.1 |
+0.1 |
21.6 |
-0.5 |
20.4 |
0.0 |
4.2 |
10.4 |
357 (14.9) |
48/10 |
| ALICE SPRINGS AIRPORT |
21.3 |
-1.7 |
2.1 |
-6.1 |
0.2 |
0.0 |
6.2 |
10.2 |
299 (12.5) |
41/13 |
| WHYALLA AERO |
21.3 |
+0.8 |
3.9 |
-4.8 |
-- |
0.0 |
3.6 |
-- |
209 ( 8.7) |
31/13 |
| ADELAIDE (KENT TOWN) |
18.4 |
-0.6 |
5.6 |
-4.6 |
-- |
4.23 |
4.0 |
-- |
98 ( 4.1) |
31/13 |
| MOUNT GAMBIER AERO |
15.5 |
-0.6 |
6.9 |
-0.4 |
4.6 |
0.0 |
1.2 |
4.2 |
340 (14.2) |
48/13 |
| MOUNT ISA AERO |
28.9 |
+1.1 |
9.4 |
-4.4 |
7.3 |
1.24 |
24.0 |
10.0 |
251 (10.5) |
35/10 |
| CAIRNS AERO |
25.3 |
-2.3 |
20.5 |
+0.6 |
20.0 |
15.0 |
5.6 |
0.6 |
481 (20.0) |
37/11 |
| TOWNSVILLE AERO |
27.2 |
-0.4 |
19.9 |
+2.3 |
17.7 |
0.2 |
5.8 |
2.8 |
440 (18.3) |
48/12 |
| MACKAY M.O |
23.6 |
-0.6 |
18.3 |
+1.2 |
-- |
20.8 |
-- |
10.2 |
504 (21.0) |
44/10 |
| ROCKHAMPTON AERO |
26.3 |
+0.3 |
15.1 |
+0.9 |
12.8 |
0.0 |
5.6 |
-- |
335 (14.0) |
39/10 |
| BUNDABERG AERO |
25.4 |
+0.8 |
12.8 |
-1.4 |
-- |
0.0 |
-- |
-- |
338 (14.1) |
41/14 |
| COOLANGATTA |
23.2 |
+0.1 |
10.6 |
-3.6 |
-- |
0.0 |
-- |
-- |
150 ( 6.3) |
26/14 |
| BRISBANE AERO |
22.9 |
-0.6 |
11.1 |
-1.7 |
9.5 |
0.0 |
3.2 |
5.9 |
304 (12.7) |
30/12 |
| TOOWOOMBA AIRPORT |
19.1 |
-0.7 |
10.6 |
+0.7 |
-- |
0.0 |
-- |
-- |
403 (16.8) |
37/09 |
| GUNNEDAH RESOURCE CENTRE |
21.8 |
+1.5 |
8.1 |
-0.6 |
2.5 |
0.0 |
3.2 |
-- |
119 ( 5.0) |
-- |
| COFFS HARBOUR MO |
21.3 |
-0.1 |
9.0 |
-2.7 |
3.2 |
0.0 |
3.0 |
8.5 |
228 ( 9.5) |
22/09 |
| PORT MACQUARIE AIRPORT AWS |
21.6 |
+0.2 |
9.9 |
-0.6 |
-- |
23.2 |
-- |
-- |
209 ( 8.7) |
21/00 |
| WILLIAMTOWN RAAF |
20.1 |
-0.2 |
7.5 |
-2.6 |
-- |
0.84 |
8.0 |
-- |
253 (10.5) |
17/08 |
| GOSFORD (NARARA RESEARCH STATION) AWS |
20.0 |
-0.3 |
9.3 |
+1.0 |
-- |
0.8 |
-- |
-- |
51 ( 2.1) |
22/12 |
| ORANGE AGRICULTURAL INSTITUTE |
14.8 |
+0.6 |
1.6 |
-3.1 |
-2.6 |
0.0 |
1.0 |
6.9 |
-- |
-- |
| DUBBO AIRPORT AWS |
20.4 |
+0.5 |
4.6 |
-2.1 |
-- |
0.0 |
-- |
-- |
301 (12.5) |
26/03 |
| SYDNEY AIRPORT AMO |
21.4 |
+1.4 |
11.7 |
+0.8 |
8.6 |
11.0 |
0.4 |
8.5 |
-- |
26/12 |
| RICHMOND RAAF |
20.6 |
+0.1 |
5.9 |
-1.8 |
-- |
0.2 |
-- |
-- |
60 ( 2.5) |
24/12 |
| BELLAMBI AWS |
21.0 |
+1.4 |
11.2 |
-1.8 |
-- |
0.0 |
-- |
-- |
273 (11.4) |
31/09 |
| WAGGA WAGGA AMO |
16.2 |
-1.1 |
0.7 |
-5.2 |
-2.1 |
0.0 |
1.6 |
9.7 |
189 ( 7.9) |
31/13 |
| ALBURY AIRPORT AWS |
15.0 |
-2.6 |
0.9 |
-4.6 |
-- |
0.0 |
-- |
-- |
32 ( 1.3) |
13/15 |
| MILDURA AIRPORT |
20.6 |
+1.6 |
2.3 |
-5.1 |
-1.9 |
0.0 |
2.0 |
9.0 |
141 ( 5.9) |
34/15 |
| TATURA INST SUSTAINABLE AG |
15.6 |
-1.6 |
-2.1 |
-7.8 |
-7.2 |
0.0 |
4.0 |
-- |
129 ( 5.4) |
21/12 |
| BENDIGO AIRPORT |
15.3 |
-1.3 |
-2.2 |
-7.4 |
-- |
0.0 |
-- |
-- |
71 ( 3.0) |
30/12 |
| MELBOURNE REGIONAL OFFICE |
17.0 |
+0.3 |
4.6 |
-4.0 |
-- |
1.63 |
5.0 |
-- |
-- |
-- |
| BALLARAT AERODROME |
12.8 |
-0.8 |
-2.5 |
-8.2 |
-- |
0.0 |
-- |
-- |
132 ( 5.5) |
�
44/14 |
| LAUNCESTON (TI TREE BEND) |
14.0 |
-1.8 |
3.1 |
-2.0 |
-- |
0.2 |
-- |
-- |
148 ( 6.2) |
52/20 |
| HOBART AIRPORT |
17.9 |
+2.7 |
5.1 |
-1.5 |
5.1 |
0.0 |
1.8 |
7.3 |
296 (12.3) |
50/14 |
| |
Max
°
C |
+/- norm
°
C |
Min
°
C |
+/- norm
°
C |
Grass Min
°
C |
Rain to 9am mm |
Evaporation to 9am mm |
Sunshine hours |
Wind Run to 9am km |
Maximum Gust km/h / hour of occurrence |
|
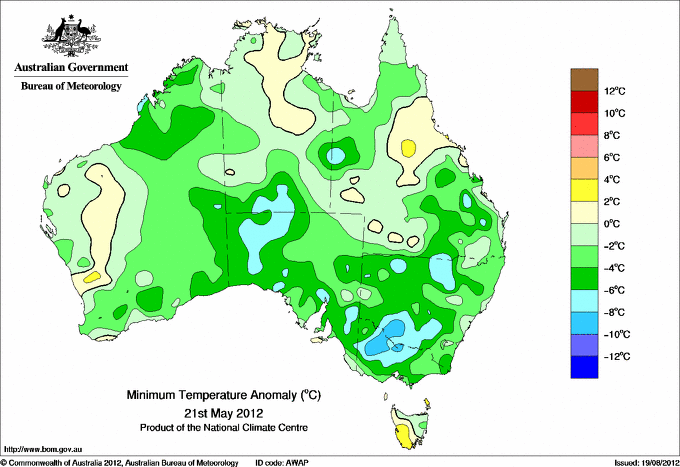
| Hottest |
| Highest maximum temperature> | Greatest variation above normal maximum |
Highest minimum temperature | Greatest variation above normal minimum |
34.5 EMU CREEK STATION W Gascoyne WA
34.3 CARNARVON AIRPORT W Gascoyne WA
34.2 MIDDLE POINT AWS N Rivers NT
33.8 MARDIE W Pilbara WA
33.6 MILINGIMBI AWS N Rivers NT
|
+8.1 : 34.3 CARNARVON AIRPORT W Gascoyne WA
+6.3 : 30.0 MULLEWA Central West WA
+6.3 : 27.8 WONGAN HILLS Central West WA
+6.0 : 27.9 DALWALLINU COMPARISON Central West WA
+5.9 : 28.5 CARNAMAH Central West WA
+5.9 : 26.6 MERREDIN Cent Wheatbelt WA
|
26.1 COCONUT ISLAND N Peninsula QLD
26.0 NORTH EAST ISLAND Islands ISL
26.0 CAPE WESSEL Islands ISL
25.6 MCCLUER ISLAND N Rivers NT
25.0 TROUGHTON ISLAND N Kimberley WA
25.0 CAPE DON N Rivers NT
|
+5.1 : 9.7 GEEVESTON (CEMETERY ROAD) Southeast TAS
+4.8 : 15.4 BADGINGARRA RESEARCH STN Lower West WA
+4.6 : 10.4 DOVER Southeast TAS
+4.2 : 6.0 BUTLERS GORGE Central Plateau TAS
+4.1 : 6.6 TARRALEAH VILLAGE Derwent Valley TAS
|
| Coldest |
| Lowest maximum temperature | Greatest variation below normal maximum |
Lowest minimum temperature | Greatest variation below normal minimum |
2.2 MOUNT HOTHAM Upper NE VIC
4.0 FALLS CREEK Upper NE VIC
4.2 MOUNT BULLER Upper NE VIC
5.5 CHARLOTTE PASS (KOSCIUSKO CHALET) Snowy Mtns NSW
5.6 MOUNT BAW BAW W Gippsland VIC
|
-5.5 : 24.1 RICHMOND AIRPORT Upper Carpentaria QLD
-3.6 : 23.5 CARDWELL MARINE PDE N Coast--Herbert QLD
-3.4 : 21.5 WALKAMIN RESEARCH STATION N Coast--Barron QLD
-3.2 : 23.0 SOUTH JOHNSTONE EXP STN N Coast--Herbert QLD
-3.0 : 22.9 PAPUNYA N Plateau NT
-3.0 : 11.5 STRATHBOGIE Lower NE VIC
-3.0 : 13.6 EDI UPPER Upper NE VIC
|
-5.0 THREDBO VILLAGE Snowy Mtns NSW
-4.3 BOMBALA AWS Goulburn/Monaro NSW
-4.0 PERISHER VALLEY AWS Snowy Mtns NSW
-3.8 COOMA AIRPORT AWS Goulburn/Monaro NSW
-3.7 RUTHERGLEN RESEARCH Lower NE VIC
|
-9.4 : -3.5 LONGERENONG Wimmera S VIC
-8.5 : -2.0 WARRACKNABEAL MUSEUM Wimmera N VIC
-8.5 : -3.5 HORSHAM AERODROME Wimmera S VIC
-8.3 : -2.3 MANGALORE AIRPORT N Central VIC
-8.3 : -2.8 ARARAT PRISON Western Plains VIC
|
|
Sunniest &
dullest |
Windiest |
Highest gusts |
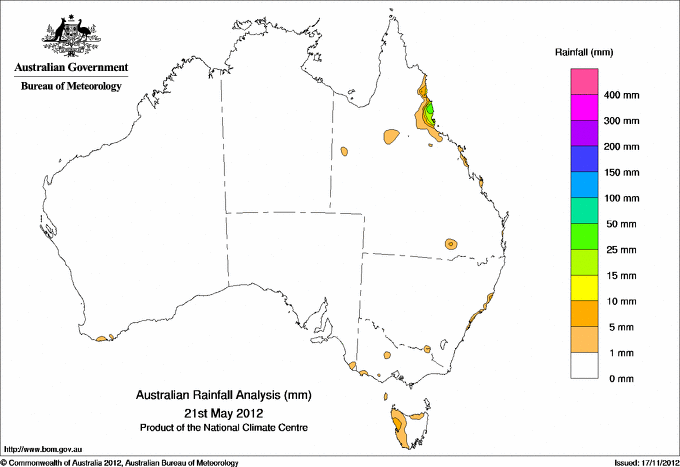
Todays highest rainfall totals for the 24 hours to 9am. It
includes the top 5 totals nationally followed by all reported falls of 50mm or more. |
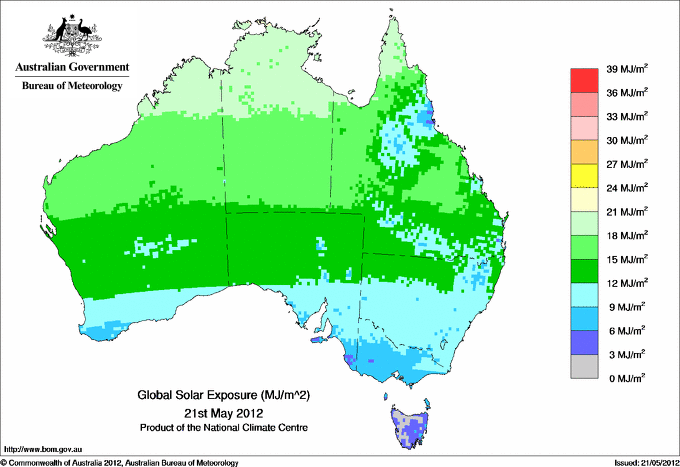
Highest
and lowest recordings of hours of sunshine for the 24 hours to midnight. |
Highest wind
run totals in kilometres for the 24 hours to 9am (average speed in brackets).
All reported runs >
=25km/h are shown. |
Highest wind
gusts in km/h for the 24 hours to midnight followed by the hour in which it occurred.
All stations with gusts >
89km/h are shown. |
67.0 TOPAZ ALERT N Coast--Barron QLD
60.2 TREE HOUSE CREEK N Coast--Barron QLD
58.6 TULLY SUGAR MILL N Coast--Herbert QLD
57.4 DARADGEE N Coast--Herbert QLD
54.0 NERADA ALERT N Coast--Herbert QLD
QUEENSLAND
N Coast--Barron
67.0 TOPAZ ALERT
60.2 TREE HOUSE CREEK
50.0 BARTLE VIEW ALERT
N Coast--Herbert
58.6 TULLY SUGAR MILL
57.4 DARADGEE
54.0 NERADA ALERT
ISLANDS
Islands
50.8 COCOS ISLAND AIRPORT
|
10.9 BROOME AIRPORT W Kimberley WA
10.7 RABBIT FLAT N Plateau NT
10.5 GOVE AIRPORT N Rivers NT
10.4 DARWIN AIRPORT N Rivers NT
10.2 ALICE SPRINGS AIRPORT N Plateau NT
10.2 MACKAY M.O Central Coast E QLD
.....
1.3 STRATHGORDON VILLAGE W Coast TAS
1.0 WALKAMIN RESEARCH STATION N Coast--Barron QLD
0.6 CAIRNS AERO N Coast--Barron QLD
0.6 LAKE LEAKE (ELIZABETH RIVER) E Coast TAS
0.0 SCOTTSDALE (WEST MINSTONE ROAD) N Coast TAS
|
1191 (49.6) MAATSUYKER ISLAND LIGHTHOUSE Southeast TAS
1159 (48.3) MOUNT WELLINGTON Southeast TAS
1024 (42.7) WILLIS ISLAND Islands ISL
974 (40.6) HARTZ MOUNTAIN (KEOGHS PIMPLE) Southeast TAS
943 (39.3) HAMILTON ISLAND AIRPORT Central Coast E QLD
828 (34.5) LOW ISLES LIGHTHOUSE N Coast--Barron QLD
764 (31.8) RUNDLE ISLAND Wide Bay/Burnett QLD
748 (31.2) MCCLUER ISLAND N Rivers NT
707 (29.5) SCOTTS PEAK DAM W Coast TAS
694 (28.9) LOW HEAD N Coast TAS
693 (28.9) HOGAN ISLAND Islands ISL
679 (28.3) LADY ELLIOT ISLAND Wide Bay/Burnett QLD
653 (27.2) MOUNT READ W Coast TAS
648 (27.0) DOUBLE ISLAND POINT LIGHTHOUSE Brisbane/SE Coast QLD
643 (26.8) CAPE GRIM BAPS (COMPARISON) N Coast TAS
619 (25.8) SWAN ISLAND E Coast TAS
|
104/18 MAATSUYKER ISLAND LIGHTHOUSE Southeast TAS
96/20 SCOTTS PEAK DAM W Coast TAS
91/07 HARTZ MOUNTAIN (KEOGHS PIMPLE) Southeast TAS
81/13 MOUNT WELLINGTON Southeast TAS
81/14 MOUNT READ W Coast TAS
|
�