|
For notes on how to interpret
the data and quality control issues, see Daily Weather Summary Help.
**S** and **W** precede data flagged by the Bureau as suspicious or wrong
Data is as received at 10:02EST, 06/07/2012.
|
|
| |
Max
°
C |
+/- norm
°
C |
Min
°
C |
+/- norm
°
C |
Grass Min
°
C |
Rain to 9am mm |
Evaporation to 9am mm |
Sunshine hours |
Wind Run to 9am km (24-hour average km/h) |
Maximum Gust km/h / hour of occurrence |
| GERALDTON AIRPORT COMPARISON |
42.8 |
+11.8 |
18.1 |
+0.2 |
-- |
0.0 |
-- |
-- |
508 (21.2) |
46/11 |
| PERTH AIRPORT |
38.3 |
+8.6 |
17.6 |
+1.7 |
15.9 |
0.0 |
8.8 |
11.6 |
473 (19.7) |
50/05 |
| ALBANY AIRPORT COMPARISON |
27.7 |
+3.6 |
16.2 |
+2.8 |
15.0 |
0.0 |
-- |
-- |
278 (11.6) |
44/16 |
| BUNBURY |
32.9 |
+5.2 |
15.2 |
+1.0 |
-- |
0.0 |
-- |
-- |
388 (16.2) |
41/08 |
| MANDURAH |
34.4 |
+6.6 |
18.0 |
-0.2 |
-- |
0.0 |
-- |
-- |
358 (14.9) |
30/01 |
| DARWIN AIRPORT |
32.6 |
+0.7 |
25.5 |
+1.0 |
24.5 |
0.0 |
6.8 |
6.6 |
265 (11.0) |
31/23 |
| ALICE SPRINGS AIRPORT |
29.8 |
-2.8 |
12.4 |
-5.1 |
11.6 |
0.0 |
8.6 |
11.7 |
293 (12.2) |
39/15 |
| WHYALLA AERO |
27.5 |
+0.3 |
11.5 |
-3.9 |
-- |
0.0 |
8.0 |
-- |
248 (10.3) |
43/17 |
| ADELAIDE (KENT TOWN) |
27.8 |
+1.5 |
12.4 |
-2.8 |
-- |
0.0 |
5.6 |
11.4 |
131 ( 5.5) |
34/12 |
| MOUNT GAMBIER AERO |
24.2 |
+1.1 |
6.7 |
-3.8 |
4.4 |
0.0 |
4.0 |
7.9 |
232 ( 9.7) |
46/11 |
| MOUNT ISA AERO |
35.9 |
+1.7 |
22.7 |
+1.0 |
-- |
0.0 |
-- |
-- |
289 (12.0) |
34/11 |
| CAIRNS AERO |
32.3 |
+1.7 |
24.2 |
+1.2 |
23.7 |
0.8 |
3.8 |
7.0 |
301 (12.5) |
39/18 |
| TOWNSVILLE AERO |
30.6 |
-0.1 |
24.1 |
+1.2 |
22.6 |
2.6 |
1.6 |
1.8 |
217 ( 9.0) |
34/15 |
| MACKAY M.O |
29.9 |
+1.3 |
24.1 |
+1.8 |
-- |
2.2 |
-- |
6.0 |
305 (12.7) |
26/00 |
| ROCKHAMPTON AERO |
33.3 |
+2.8 |
20.7 |
-0.1 |
19.2 |
0.0 |
5.4 |
-- |
178 ( 7.4) |
39/14 |
| BUNDABERG AERO |
31.8 |
+2.7 |
20.3 |
+0.4 |
-- |
0.0 |
-- |
-- |
321 (13.4) |
31/15 |
| NAMBOUR DPI |
31.0 |
+3.1 |
18.0 |
-0.3 |
-- |
0.0 |
-- |
-- |
-- |
-- |
| COOLANGATTA |
29.1 |
+1.8 |
17.1 |
-2.6 |
-- |
0.0 |
-- |
-- |
197 ( 8.2) |
26/12 |
| BRISBANE AERO |
30.1 |
+2.2 |
18.9 |
-0.5 |
19.0 |
0.0 |
7.0 |
11.7 |
282 (11.8) |
31/08 |
| TOOWOOMBA AIRPORT |
26.4 |
+0.3 |
13.7 |
-2.5 |
-- |
0.0 |
-- |
-- |
284 (11.8) |
41/16 |
| GUNNEDAH RESOURCE CENTRE |
27.7 |
-1.4 |
12.0 |
-4.6 |
8.6 |
0.0 |
4.6 |
-- |
64 ( 2.7) |
-- |
| COFFS HARBOUR MO |
27.2 |
+1.3 |
14.3 |
-3.8 |
12.6 |
0.0 |
4.8 |
11.7 |
384 (16.0) |
28/00 |
| PORT MACQUARIE AIRPORT AWS |
28.5 |
+2.2 |
14.1 |
-2.7 |
-- |
0.0 |
-- |
-- |
226 ( 9.4) |
28/12 |
| WILLIAMTOWN RAAF |
29.1 |
+2.9 |
13.3 |
-3.0 |
11.7 |
1.0 |
-- |
-- |
367 (15.3) |
46/10 |
| GOSFORD (NARARA RESEARCH STATION) AWS |
28.0 |
+2.0 |
13.1 |
-2.3 |
-- |
25.6 |
-- |
-- |
93 ( 3.9) |
26/11 |
| ORANGE AGRICULTURAL INSTITUTE |
19.6 |
-3.1 |
9.1 |
-1.5 |
3.6 |
0.4 |
2.8 |
8.1 |
-- |
-- |
| DUBBO AIRPORT AWS |
26.8 |
-2.2 |
9.6 |
-5.0 |
-- |
0.0 |
-- |
-- |
230 ( 9.6) |
41/15 |
| SYDNEY AIRPORT AMO |
28.1 |
+2.9 |
14.9 |
-2.6 |
11.4 |
12.4 |
1.2 |
10.7 |
451 (18.8) |
43/14 |
| RICHMOND RAAF |
27.9 |
+0.9 |
12.4 |
-3.2 |
-- |
1.4 |
-- |
-- |
113 ( 4.7) |
31/12 |
| BELLAMBI AWS |
25.4 |
+1.4 |
14.5 |
-3.6 |
-- |
16.2 |
-- |
-- |
304 (12.7) |
39/19 |
| CANBERRA AIRPORT |
24.0 |
-0.5 |
9.0 |
-1.8 |
-- |
3.0 |
-- |
-- |
-- |
-- |
| WAGGA WAGGA AMO |
25.8 |
-1.8 |
11.3 |
-2.1 |
10.4 |
0.0 |
5.2 |
11.6 |
319 (13.3) |
37/12 |
| ALBURY AIRPORT AWS |
27.1 |
-0.6 |
12.1 |
-0.6 |
-- |
0.4 |
-- |
-- |
127 ( 5.3) |
37/15 |
| MILDURA AIRPORT |
29.5 |
+1.2 |
11.1 |
-2.7 |
8.4 |
0.0 |
4.8 |
11.5 |
212 ( 8.8) |
39/13 |
| TATURA INST SUSTAINABLE AG |
26.5 |
+0.3 |
13.9 |
+2.2 |
-- |
0.0 |
5.6 |
-- |
455 (19.0) |
35/13 |
| BENDIGO AIRPORT |
26.0 |
+0.2 |
11.2 |
-0.2 |
-- |
0.0 |
-- |
-- |
386 (16.1) |
�
43/11 |
| MELBOURNE REGIONAL OFFICE |
25.9 |
+2.0 |
16.6 |
+3.4 |
15.5 |
0.0 |
2.4 |
-- |
-- |
-- |
| BALLARAT AERODROME |
23.9 |
+1.7 |
12.0 |
+2.1 |
-- |
0.0 |
-- |
-- |
499 (20.8) |
46/14 |
| LAUNCESTON (TI TREE BEND) |
24.2 |
+1.7 |
11.7 |
+1.6 |
-- |
0.0 |
-- |
-- |
312 (13.0) |
35/16 |
| HOBART AIRPORT |
21.6 |
+0.9 |
13.4 |
+2.6 |
12.9 |
0.8 |
2.0 |
5.0 |
218 ( 9.1) |
39/20 |
| |
Max
°
C |
+/- norm
°
C |
Min
°
C |
+/- norm
°
C |
Grass Min
°
C |
Rain to 9am mm |
Evaporation to 9am mm |
Sunshine hours |
Wind Run to 9am km |
Maximum Gust km/h / hour of occurrence |
|
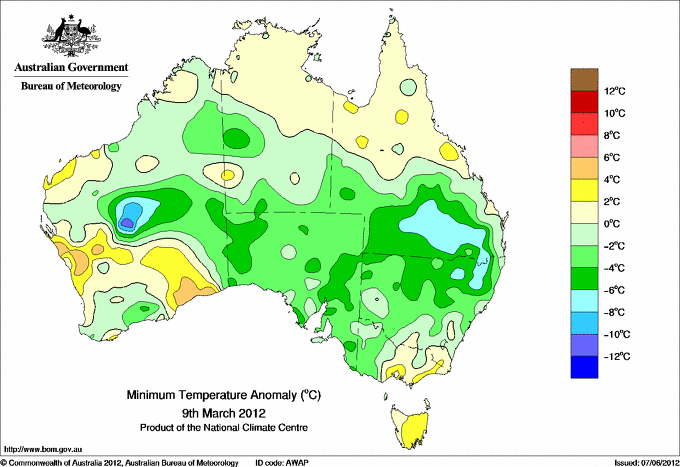
| Hottest |
| Highest maximum temperature> | Greatest variation above normal maximum |
Highest minimum temperature | Greatest variation above normal minimum |
44.6 KALBARRI Central West WA
43.1 ENEABBA Central West WA
43.0 GERALDTON AIRPORT Central West WA
42.8 GERALDTON AIRPORT COMPARISON Central West WA
41.8 SHARK BAY AIRPORT W Gascoyne WA
|
+12.2 : 40.7 LANCELIN Lower West WA
+12.0 : 44.6 KALBARRI Central West WA
+11.8 : 42.8 GERALDTON AIRPORT COMPARISON Central West WA
+10.6 : 40.0 JURIEN BAY Lower West WA
+9.7 : 39.0 MEDINA RESEARCH CENTRE Lower West WA
|
29.0 VARANUS ISLAND Islands ISL
28.9 THEVENARD ISLAND W Pilbara WA
28.8 BARROW ISLAND AIRPORT W Pilbara WA
28.0 BEDOUT ISLAND E Pilbara WA
27.6 KARRATHA AERO E Pilbara WA
|
+5.4 : 24.5 KALBARRI Central West WA
+5.3 : 25.0 YUENDUMU N Plateau NT
+5.1 : 23.5 MULLEWA Central West WA
+5.0 : 19.3 EYRE Eucla WA
+4.9 : 12.8 ROSS (THE BOULEVARDS) Midlands TAS
|
| Coldest |
| Lowest maximum temperature | Greatest variation below normal maximum |
Lowest minimum temperature | Greatest variation below normal minimum |
10.8 THREDBO AWS Snowy Mtns NSW
11.2 MOUNT BAW BAW W Gippsland VIC
11.2 MOUNT READ W Coast TAS
11.5 MOUNT WELLINGTON Southeast TAS
12.2 MOUNT HOTHAM Upper NE VIC
|
-5.3 : 16.8 POINT HICKS (LIGHTHOUSE) E Gippsland VIC
-4.8 : 16.7 COMBIENBAR AWS E Gippsland VIC
-4.5 : 23.4 GRENFELL (MANGANESE RD) SW Slopes N NSW
-4.3 : 32.5 MANDORA E Pilbara WA
-3.8 : 21.0 WOOLBROOK (DANGLEMAH ROAD) NW Slopes S NSW
-3.8 : 13.8 CABRAMURRA SMHEA AWS SW Slopes S NSW
|
2.1 GLEN INNES AIRPORT AWS N Tablelands W NSW
3.1 MOUNT HOTHAM Upper NE VIC
3.6 THREDBO AWS Snowy Mtns NSW
3.6 MOUNT WELLINGTON Southeast TAS
3.8 ROBE AIRFIELD Lower SE SA
3.8 WOOLBROOK (DANGLEMAH ROAD) NW Slopes S NSW
|
-9.0 : 10.5 WILUNA Interior WA
-8.8 : 5.0 STANTHORPE LESLIE PARADE Darling Downs E QLD
-8.5 : 2.1 GLEN INNES AIRPORT AWS N Tablelands W NSW
-8.4 : 8.9 ROMA AIRPORT Maranoa QLD
-7.9 : 7.0 WARWICK Darling Downs E QLD
|
|
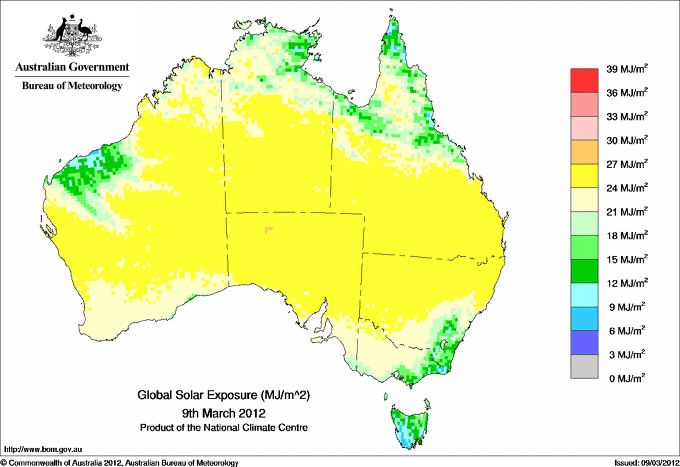
Sunniest &
dullest |
Windiest |
Highest gusts |
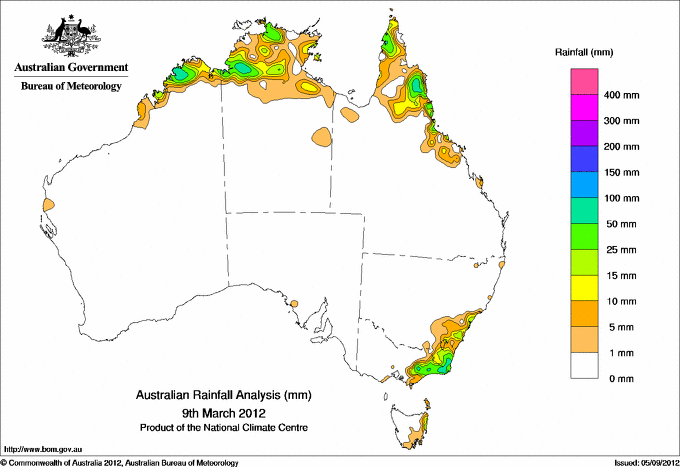
Todays highest rainfall totals for the 24 hours to 9am. It
includes the top 5 totals nationally followed by all reported falls of 50mm or more. |
Highest
and lowest recordings of hours of sunshine for the 24 hours to midnight. |
Highest wind
run totals in kilometres for the 24 hours to 9am (average speed in brackets).
All reported runs >
=25km/h are shown. |
Highest wind
gusts in km/h for the 24 hours to midnight followed by the hour in which it occurred.
All stations with gusts >
89km/h are shown. |
114.8 MOUNT WELLINGTON W Gippsland VIC
91.0 DUNK ISLAND RESORT N Coast--Herbert QLD
87.0 BELLENDEN KER BOTTOM STN N Coast--Barron QLD
84.4 BRADSHAW N Rivers NT
82.6 REEVES KNOB W Gippsland VIC
WESTERN AUSTRALIA
N Kimberley
52.0 DOONGAN
NORTHERN TERRITORY
N Rivers
84.4 BRADSHAW
56.0 OENPELLI
52.0 LEGUNE
QUEENSLAND
N Peninsula
69.8 WEIPA AERO
68.6 SCHERGER RAAF
S Peninsula
76.0 LAURA POST OFFICE
68.0 MAITLAND DOWNS STATION
N Coast--Barron
87.0 BELLENDEN KER BOTTOM STN
66.4 MALANDA
64.0 MOSSMAN CENTRAL MILL
59.0 MALANDA ALERT
58.0 HAPPY VALLEY
53.4 MOSSMAN SOUTH ALCHERA DRIVE
N Coast--Herbert
91.0 DUNK ISLAND RESORT
55.0 MUTARNEE STORE
54.0 CRAWFORDS LOOKOUT ALERT
NEW SOUTH WALES
Illawarra
52.6 WOMBARRA (REEF AVE)
South Coast
77.6 KAMERUKA (KAMERUKA ESTATE)
72.8 PAMBULA POST OFFICE
69.6 CANDELO (KANOONA (TILLSIDE))
63.0 BEGA AWS
63.0 BOMBALA (MOUNTAIN TOP)
62.0 WAPENGO LAKE ROAD
58.0 CANDELO POST OFFICE
57.8 BEMBOKA POST OFFICE
57.4 BROGO (HAWKS HEAD ROAD)
54.8 TATHRA (PANORAMA DRIVE)
Goulburn/Monaro
52.0 CRAIGIE (BONDI FOREST LODGE)
VICTORIA
E Gippsland
68.0 GENOA (FOOLS HAVEN)
59.2 BULLUMWAAL
58.8 CLUB TERRACE
56.2 COMBIENBAR AWS
55.0 MOUNT NOWA NOWA
54.2 CABBAGE TREE CREEK
54.2 COMBIENBAR
50.0 CANN RIVER
W Gippsland
114.8 MOUNT WELLINGTON
82.6 REEVES KNOB
80.2 MOUNT MOORNAPA
75.4 BALOOK
TASMANIA
E Coast
64.4 GRAY (DALMAYNE RD)
ISLANDS
Islands
81.0 LORD HOWE ISLAND AERO
74.0 LORD HOWE ISLAND (MIDDLE BEACH)
71.0 LORD HOWE ISLAND (MILKY WAY)
63.0 CHRISTMAS ISLAND AERO
|
11.8 WOOMERA AERODROME NW Pastoral SA
11.7 ALICE SPRINGS AIRPORT N Plateau NT
11.7 BRISBANE AERO Brisbane/SE Coast QLD
11.7 COFFS HARBOUR MO MidNorth Coast N NSW
11.6 PERTH AIRPORT Lower West WA
11.6 CEDUNA AMO W Agricultural SA
11.6 LOXTON RESEARCH CENTRE Murray Valley SA
11.6 MOREE AERO NW Plains E NSW
11.6 WAGGA WAGGA AMO SW Slopes S NSW
.....
3.7 BICHENO (COUNCIL DEPOT) E Coast TAS
3.5 GOVE AIRPORT N Rivers NT
3.5 LAKE LEAKE (ELIZABETH RIVER) E Coast TAS
3.1 STRATHGORDON VILLAGE W Coast TAS
1.8 TOWNSVILLE AERO N Coast--Herbert QLD
|
1232 (51.3) MOUNT HOTHAM Upper NE VIC
995 (41.5) FALLS CREEK Upper NE VIC
866 (36.1) MOUNT BULLER Upper NE VIC
849 (35.4) HOGAN ISLAND Islands ISL
834 (34.8) SWAN ISLAND E Coast TAS
829 (34.5) CAPE LEEUWIN Lower West WA
791 (33.0) NORTH ISLAND Central West WA
757 (31.5) EDDYSTONE POINT E Coast TAS
687 (28.6) LORD HOWE ISLAND AERO Islands ISL
659 (27.5) CAPE NATURALISTE Lower West WA
653 (27.2) ROTTNEST ISLAND Lower West WA
631 (26.3) WILSONS PROMONTORY LIGHTHOUSE W Gippsland VIC
619 (25.8) DOUBLE ISLAND POINT LIGHTHOUSE Brisbane/SE Coast QLD
605 (25.2) BADGINGARRA RESEARCH STN Lower West WA
|
83/17 MAATSUYKER ISLAND LIGHTHOUSE Southeast TAS
83/22 HOGAN ISLAND Islands ISL
81/17 HARTZ MOUNTAIN (KEOGHS PIMPLE) Southeast TAS
78/23 WILSONS PROMONTORY LIGHTHOUSE W Gippsland VIC
76/18 CAPE GRIM BAPS (COMPARISON) N Coast TAS
|
�