|
For notes on how to interpret
the data and quality control issues, see Daily Weather Summary Help.
**S** and **W** precede data flagged by the Bureau as suspicious or wrong
Data is as received at 03:13EST, 20/04/2013.
|
|
| |
Max
°
C |
+/- norm
°
C |
Min
°
C |
+/- norm
°
C |
Grass Min
°
C |
Rain to 9am mm |
Evaporation to 9am mm |
Sunshine hours |
Wind Run to 9am km (24-hour average km/h) |
Maximum Gust km/h / hour of occurrence |
| GERALDTON AIRPORT COMPARISON |
21.0 |
+1.0 |
8.9 |
0.0 |
-- |
0.6 |
-- |
-- |
271 (11.3) |
28/07 |
| PERTH AIRPORT |
20.2 |
+1.7 |
7.1 |
-0.9 |
6.0 |
0.4 |
1.8 |
5.7 |
272 (11.3) |
34/14 |
| ALBANY AIRPORT COMPARISON |
17.0 |
+0.9 |
6.1 |
-1.4 |
-- |
0.0 |
-- |
-- |
267 (11.1) |
41/12 |
| BUNBURY |
18.2 |
+0.7 |
2.2 |
-5.3 |
-- |
0.8 |
-- |
-- |
140 ( 5.8) |
41/13 |
| MANDURAH |
18.4 |
+0.6 |
10.1 |
-0.7 |
-- |
1.8 |
-- |
-- |
192 ( 8.0) |
44/17 |
| DARWIN AIRPORT |
30.4 |
-1.0 |
17.3 |
-3.1 |
16.2 |
0.0 |
5.4 |
10.6 |
291 (12.1) |
35/12 |
| ALICE SPRINGS AIRPORT |
25.1 |
+2.5 |
4.4 |
-1.6 |
1.7 |
0.0 |
5.2 |
10.5 |
225 ( 9.4) |
31/13 |
| WHYALLA AERO |
20.0 |
+1.5 |
7.7 |
+1.8 |
-- |
0.0 |
4.0 |
-- |
341 (14.2) |
44/15 |
| ADELAIDE (KENT TOWN) |
16.4 |
-0.2 |
10.4 |
+2.2 |
-- |
1.4 |
-- |
-- |
235 ( 9.8) |
55/11 |
| MOUNT GAMBIER AERO |
13.8 |
-0.3 |
8.1 |
+2.6 |
6.4 |
5.2 |
0.0 |
5.8 |
499 (20.8) |
81/14 |
| MOUNT ISA AERO |
28.0 |
+0.7 |
1.4 |
-8.9 |
0.4 |
0.0 |
15.0 |
10.7 |
132 ( 5.5) |
43/13 |
| CAIRNS AERO |
26.1 |
-0.5 |
12.8 |
-4.6 |
9.1 |
0.0 |
5.2 |
9.3 |
378 (15.8) |
37/11 |
| TOWNSVILLE AERO |
23.9 |
-2.1 |
10.2 |
-4.5 |
5.6 |
0.0 |
4.6 |
10.2 |
141 ( 5.9) |
24/12 |
| MACKAY M.O |
21.2 |
-1.4 |
10.3 |
-3.7 |
-- |
0.0 |
-- |
-- |
258 (10.8) |
22/04 |
| ROCKHAMPTON AERO |
24.7 |
-0.1 |
6.5 |
-4.2 |
3.6 |
0.0 |
3.2 |
-- |
111 ( 4.6) |
28/17 |
| BUNDABERG AERO |
23.2 |
-0.1 |
3.6 |
-7.3 |
-- |
0.0 |
-- |
-- |
159 ( 6.6) |
30/14 |
| COOLANGATTA |
22.3 |
+1.0 |
4.9 |
-5.5 |
-- |
0.0 |
-- |
-- |
161 ( 6.7) |
30/11 |
| BRISBANE AERO |
22.6 |
+0.9 |
3.8 |
-5.8 |
-0.4 |
0.0 |
4.0 |
10.2 |
221 ( 9.2) |
31/16 |
| TOOWOOMBA AIRPORT |
18.9 |
+0.4 |
5.2 |
-2.3 |
-- |
0.0 |
-- |
-- |
269 (11.2) |
35/14 |
| GUNNEDAH RESOURCE CENTRE |
20.1 |
+2.2 |
2.4 |
-3.4 |
-1.4 |
0.0 |
2.8 |
-- |
48 ( 2.0) |
-- |
| COFFS HARBOUR MO |
21.2 |
+1.4 |
3.8 |
-4.5 |
0.5 |
0.0 |
2.4 |
10.4 |
232 ( 9.7) |
31/14 |
| PORT MACQUARIE AIRPORT AWS |
22.3 |
+2.1 |
4.7 |
-2.1 |
-- |
0.0 |
-- |
-- |
177 ( 7.4) |
26/12 |
| WILLIAMTOWN RAAF |
21.4 |
+2.8 |
5.1 |
-1.8 |
-- |
0.0 |
10.4 |
-- |
356 (14.8) |
52/13 |
| GOSFORD (NARARA RESEARCH STATION) AWS |
21.6 |
+2.6 |
1.6 |
-3.8 |
-- |
0.0 |
-- |
-- |
55 ( 2.3) |
34/12 |
| ORANGE AGRICULTURAL INSTITUTE |
13.2 |
+2.2 |
1.0 |
-1.1 |
-7.0 |
0.0 |
2.0 |
9.2 |
-- |
-- |
| DUBBO AIRPORT AWS |
20.3 |
+2.8 |
-1.3 |
-4.8 |
-- |
0.0 |
-- |
-- |
113 ( 4.7) |
41/14 |
| SYDNEY AIRPORT AMO |
22.6 |
+4.3 |
6.5 |
-1.6 |
0.0 |
0.0 |
1.6 |
7.7 |
323 (13.5) |
43/13 |
| RICHMOND RAAF |
23.0 |
+3.3 |
0.1 |
-4.3 |
-- |
0.0 |
-- |
-- |
160 ( 6.7) |
48/13 |
| BELLAMBI AWS |
20.8 |
+2.8 |
8.7 |
-1.8 |
-- |
0.0 |
-- |
-- |
257 (10.7) |
54/10 |
| WAGGA WAGGA AMO |
16.3 |
+1.8 |
-0.2 |
-3.8 |
-2.4 |
0.8 |
1.4 |
4.0 |
170 ( 7.1) |
43/20 |
| ALBURY AIRPORT AWS |
16.6 |
+1.6 |
3.0 |
-0.8 |
-- |
2.0 |
-- |
-- |
85 ( 3.5) |
54/18 |
| MILDURA AIRPORT |
19.6 |
+2.3 |
7.7 |
+2.4 |
2.5 |
0.0 |
2.8 |
8.7 |
283 (11.8) |
50/13 |
| TATURA INST SUSTAINABLE AG |
16.2 |
+1.5 |
6.1 |
+2.2 |
-- |
0.0 |
-- |
-- |
273 (11.4) |
57/15 |
| BENDIGO AIRPORT |
15.0 |
+0.7 |
3.6 |
+1.0 |
-- |
2.0 |
-- |
-- |
142 ( 5.9) |
59/13 |
| MELBOURNE REGIONAL OFFICE |
17.2 |
+2.2 |
10.0 |
+3.3 |
-- |
0.2 |
-- |
-- |
-- |
-- |
| BALLARAT AERODROME |
12.0 |
+0.6 |
5.1 |
+1.4 |
-- |
0.2 |
-- |
-- |
560 (23.3) |
�
61/16 |
| LAUNCESTON (TI TREE BEND) |
11.6 |
-2.2 |
4.5 |
+0.8 |
-- |
8.6 |
-- |
-- |
219 ( 9.1) |
67/12 |
| HOBART AIRPORT |
14.8 |
+1.3 |
4.8 |
+0.1 |
1.0 |
0.0 |
1.6 |
4.4 |
322 (13.4) |
65/15 |
| |
Max
°
C |
+/- norm
°
C |
Min
°
C |
+/- norm
°
C |
Grass Min
°
C |
Rain to 9am mm |
Evaporation to 9am mm |
Sunshine hours |
Wind Run to 9am km |
Maximum Gust km/h / hour of occurrence |
|
| Hottest |
| Highest maximum temperature> | Greatest variation above normal maximum |
Highest minimum temperature | Greatest variation above normal minimum |
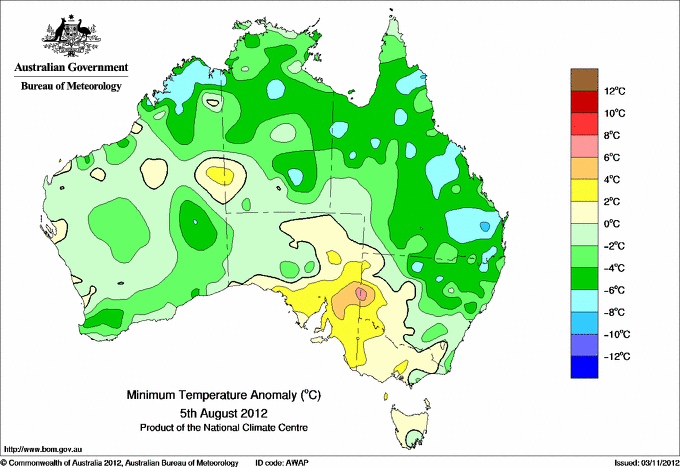
34.7 ELLIOTT N Plateau NT
34.6 KALUMBURU N Kimberley WA
34.5 WYNDHAM AERO N Kimberley WA
34.3 CURTIN AERO W Kimberley WA
34.3 MIDDLE POINT AWS N Rivers NT
34.3 JABIRU AIRPORT N Rivers NT
|
+5.2 : 32.3 ONSLOW AIRPORT W Pilbara WA
+4.8 : 22.0 CONDOBOLIN AIRPORT AWS CW Plains S NSW
+4.7 : 25.1 TIBOOBURRA POST OFFICE Far Northwest NSW
+4.4 : 21.7 TRANGIE RESEARCH STATION AWS CW Plains N NSW
+4.4 : 21.5 HILLSTON AIRPORT Riverina W NSW
|
24.4 COCOS ISLAND AIRPORT Islands ISL
24.2 COCONUT ISLAND N Peninsula QLD
23.3 MCCLUER ISLAND N Rivers NT
**S** 23.0 BEDOUT ISLAND E Pilbara WA
22.4 CHRISTMAS ISLAND AERO Islands ISL
|
+6.6 : 12.4 BROKEN HILL AIRPORT AWS Lower Darling NSW
+5.7 : 12.1 BROKEN HILL (PATTON STREET) Lower Darling NSW
+5.0 : 10.0 NURIOOTPA VITICULTURAL Adelaide/Lofty SA
+4.7 : 7.2 YONGALA Upper North SA
+4.5 : 9.0 CLARE HIGH SCHOOL Lower North SA
+4.5 : 8.8 COLDSTREAM E Central VIC
|
| Coldest |
| Lowest maximum temperature | Greatest variation below normal maximum |
Lowest minimum temperature | Greatest variation below normal minimum |
-0.9 MOUNT HOTHAM Upper NE VIC
-0.8 THREDBO AWS Snowy Mtns NSW
0.0 FALLS CREEK Upper NE VIC
0.4 MOUNT BULLER Upper NE VIC
0.7 PERISHER VALLEY AWS Snowy Mtns NSW
|
-3.3 : 26.5 CHANNEL POINT N Rivers NT
-3.1 : 7.3 SCOTTS PEAK DAM W Coast TAS
-2.9 : 24.0 SWEERS ISLAND Gulf Country QLD
-2.6 : 23.3 CARDWELL MARINE PDE N Coast--Herbert QLD
-2.5 : 22.6 ALVA BEACH Central Coast E QLD
-2.5 : 5.4 DINNER PLAIN (MOUNT HOTHAM AIRPORT) Upper NE VIC
|
-8.1 GLEN INNES AIRPORT AWS N Tablelands W NSW
-6.6 WOOLBROOK (DANGLEMAH ROAD) NW Slopes S NSW
-6.0 TENTERFIELD (FEDERATION PARK) N Tablelands W NSW
-5.7 ARMIDALE (TREE GROUP NURSERY) N Tablelands W NSW
-5.5 INVERELL (RAGLAN ST) N Tablelands W NSW
|
-8.9 : 1.4 MOUNT ISA AERO Gulf Country QLD
-8.2 : 8.0 DERBY AERO W Kimberley WA
-8.1 : 6.4 BOWEN AIRPORT Central Coast E QLD
-7.9 : -6.0 TENTERFIELD (FEDERATION PARK) N Tablelands W NSW
|
|
Sunniest &
dullest |
Windiest |
Highest gusts |
Todays highest rainfall totals for the 24 hours to 9am. It
includes the top 5 totals nationally followed by all reported falls of 50mm or more. |
Highest
and lowest recordings of hours of sunshine for the 24 hours to midnight. |
Highest wind
run totals in kilometres for the 24 hours to 9am (average speed in brackets).
All reported runs >
=25km/h are shown. |
Highest wind
gusts in km/h for the 24 hours to midnight followed by the hour in which it occurred.
All stations with gusts >
89km/h are shown. |
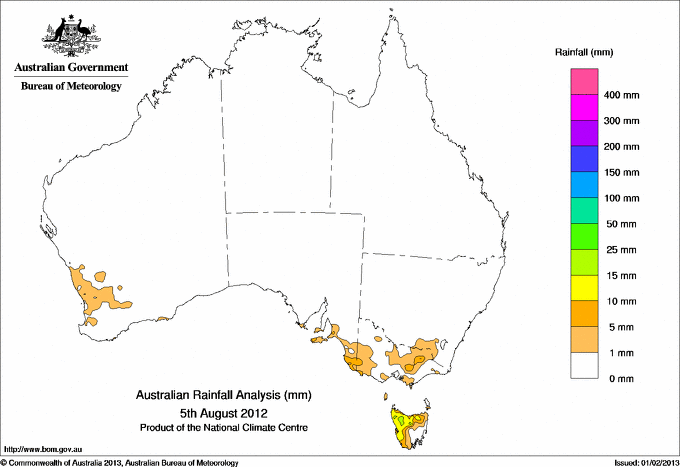
31.6 WAYATINAH (SALTAS) Derwent Valley TAS
27.8 TULLAH (MEREDITH STREET) W Coast TAS
21.6 KANGARILLA (SADDLEBAGS) Adelaide/Lofty SA
20.6 WARATAH (MOUNT ROAD) W Coast TAS
19.6 QUAMBY BLUFF N Coast TAS
|
11.0 BROOME AIRPORT W Kimberley WA
11.0 TENNANT CREEK AIRPORT N Plateau NT
10.9 GILES METEOROLOGICAL OFFICE Interior WA
10.8 RABBIT FLAT N Plateau NT
10.8 WEIPA AERO N Peninsula QLD
.....
3.8 LAKE LEAKE (ELIZABETH RIVER) E Coast TAS
2.6 LAKE EILDON N Central VIC
0.9 STRATHGORDON VILLAGE W Coast TAS
0.1 SCOTTSDALE (WEST MINSTONE ROAD) N Coast TAS
**W** 0.0 WALKAMIN RESEARCH STATION N Coast--Barron QLD
|
1109 (46.2) MOUNT WELLINGTON Southeast TAS
1080 (45.0) NEPTUNE ISLAND W Agricultural SA
1032 (43.0) THREDBO AWS Snowy Mtns NSW
991 (41.3) MAATSUYKER ISLAND LIGHTHOUSE Southeast TAS
985 (41.0) HOGAN ISLAND Islands ISL
879 (36.6) MOUNT BULLER Upper NE VIC
868 (36.2) CAPE SORELL W Coast TAS
859 (35.8) KING ISLAND AIRPORT King Island TAS
852 (35.5) SWAN ISLAND E Coast TAS
849 (35.4) CAPE GRIM BAPS (COMPARISON) N Coast TAS
827 (34.5) CAPE BORDA Yorke Pen/Kanga Is SA
824 (34.3) LOW HEAD N Coast TAS
820 (34.2) COLAC (MOUNT GELLIBRAND) W Coast VIC
818 (34.1) GRAMPIANS (MOUNT WILLIAM) Wimmera S VIC
817 (34.0) FALLS CREEK Upper NE VIC
808 (33.7) LOW ROCKY POINT W Coast TAS
797 (33.2) CAPE GRIM N Coast TAS
765 (31.9) MOUNT READ W Coast TAS
755 (31.5) COCOS ISLAND AIRPORT Islands ISL
740 (30.8) PERISHER VALLEY AWS Snowy Mtns NSW
726 (30.3) FLINDERS ISLAND AIRPORT Flinders Is/Bass St TAS
694 (28.9) CAPE WILLOUGHBY Yorke Pen/Kanga Is SA
686 (28.6) WILLIS ISLAND Islands ISL
684 (28.5) MOUNT CRAWFORD (MT CRAWFORD AWS) Adelaide/Lofty SA
683 (28.5) CAPE JAFFA (THE LIMESTONE) Lower SE SA
682 (28.4) SCOTTS PEAK DAM W Coast TAS
676 (28.2) CABRAMURRA SMHEA AWS SW Slopes S NSW
659 (27.5) MCCLUER ISLAND N Rivers NT
648 (27.0) CAPE OTWAY LIGHTHOUSE W Coast VIC
643 (26.8) CAPE NELSON LIGHTHOUSE W Coast VIC
632 (26.3) EDDYSTONE POINT E Coast TAS
629 (26.2) MARIA ISLAND (POINT LESUEUR) E Coast TAS
624 (26.0) DINNER PLAIN (MOUNT HOTHAM AIRPORT) Upper NE VIC
617 (25.7) MOUNT BOYCE AWS C Tablelands S NSW
|
144/23 WILSONS PROMONTORY LIGHTHOUSE W Gippsland VIC
135/19 CAPE GRIM BAPS (COMPARISON) N Coast TAS
135/19 MAATSUYKER ISLAND LIGHTHOUSE Southeast TAS
130/22 HOGAN ISLAND Islands ISL
126/16 SCOTTS PEAK DAM W Coast TAS
117/22 CAPE GRIM N Coast TAS
115/16 LOW ROCKY POINT W Coast TAS
109/08 MOUNT BULLER Upper NE VIC
107/02 THREDBO AWS Snowy Mtns NSW
107/21 FALLS CREEK Upper NE VIC
107/05 MOUNT WELLINGTON Southeast TAS
104/15 CAPE OTWAY LIGHTHOUSE W Coast VIC
104/14 COLAC (MOUNT GELLIBRAND) W Coast VIC
104/11 AIREYS INLET W Coast VIC
102/13 SMITHTON AERODROME N Coast TAS
102/11 CAPE SORELL W Coast TAS
100/17 TASMAN ISLAND Southeast TAS
100/13 MOUNT READ W Coast TAS
98/16 CAPE NELSON LIGHTHOUSE W Coast VIC
96/15 FLINDERS ISLAND AIRPORT Flinders Is/Bass St TAS
96/10 PORTLAND NTC AWS W Coast VIC
94/15 MARIA ISLAND (POINT LESUEUR) E Coast TAS
93/15 HARTZ MOUNTAIN (KEOGHS PIMPLE) Southeast TAS
93/15 STRAHAN AERODROME W Coast TAS
93/04 GRAMPIANS (MOUNT WILLIAM) Wimmera S VIC
91/19 CABRAMURRA SMHEA AWS SW Slopes S NSW
91/12 DEVONPORT AIRPORT N Coast TAS
91/14 LOW HEAD N Coast TAS
91/14 KING ISLAND AIRPORT King Island TAS
91/18 PERISHER VALLEY AWS Snowy Mtns NSW
|
�