|
For notes on how to interpret
the data and quality control issues, see Daily Weather Summary Help.
**S** and **W** precede data flagged by the Bureau as suspicious or wrong
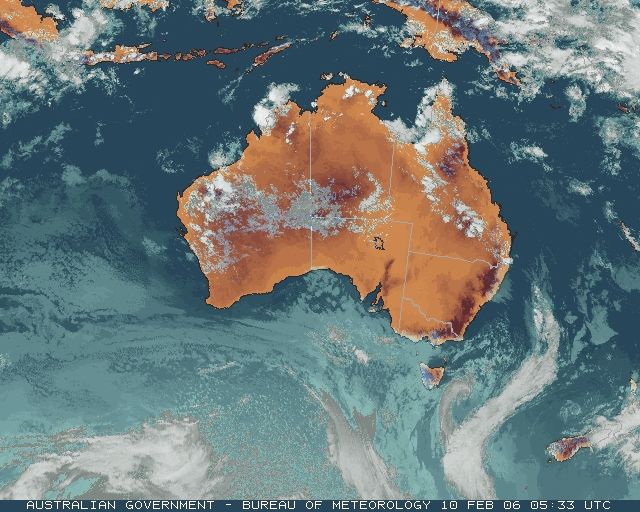
Data is as received at 22:13EST, 14/05/2012.
|
|
| |
Max
°
C |
+/- norm
°
C |
Min
°
C |
+/- norm
°
C |
Grass Min
°
C |
Rain to 9am mm |
Evaporation to 9am mm |
Sunshine hours |
Wind Run to 9am km (24-hour average km/h) |
Maximum Gust km/h / hour of occurrence |
| GERALDTON AIRPORT |
34.2 |
+1.7 |
22.4 |
+3.3 |
20.8 |
0.0 |
9.0 |
-- |
457 (19.0) |
43/16 |
| PERTH AIRPORT |
34.5 |
+2.7 |
18.7 |
+1.3 |
18.0 |
0.0 |
11.4 |
11.6 |
507 (21.1) |
50/01 |
| ALBANY AIRPORT |
22.0 |
-2.9 |
7.6 |
-6.8 |
6.0 |
0.0 |
6.6 |
11.8 |
-- |
41/12 |
| BUNBURY |
34.1 |
+4.3 |
14.2 |
-1.4 |
-- |
0.0 |
-- |
-- |
318 (13.3) |
43/21 |
| MANDURAH |
30.6 |
-- |
17.1 |
-- |
-- |
0.0 |
-- |
-- |
329 (13.7) |
39/16 |
| DARWIN AIRPORT |
32.6 |
+1.2 |
23.8 |
-0.9 |
23.4 |
0.2 |
8.2 |
11.8 |
370 (15.4) |
39/01 |
| ALICE SPRINGS AIRPORT |
33.3 |
-1.8 |
22.3 |
+1.5 |
20.9 |
0.0 |
17.2 |
9.8 |
538 (22.4) |
39/07 |
| WHYALLA AERO |
23.1 |
-6.5 |
15.7 |
-2.0 |
-- |
0.0 |
8.0 |
-- |
549 (22.9) |
46/19 |
| ADELAIDE (KENT TOWN) |
23.2 |
-6.1 |
13.2 |
-3.9 |
12.2 |
0.0 |
5.8 |
8.4 |
327 (13.6) |
39/17 |
| MOUNT GAMBIER AERO |
20.5 |
-4.6 |
10.6 |
-1.0 |
8.0 |
0.4 |
6.6 |
4.8 |
457 (19.0) |
35/15 |
| MOUNT ISA AERO |
37.5 |
+2.2 |
24.1 |
+0.7 |
23.7 |
0.0 |
9.8 |
9.8 |
280 (11.7) |
43/03 |
| CAIRNS AERO |
34.1 |
+2.9 |
24.5 |
+0.8 |
23.4 |
0.2 |
8.2 |
10.7 |
336 (14.0) |
37/14 |
| TOWNSVILLE AERO |
32.8 |
+1.7 |
25.4 |
+1.3 |
23.1 |
0.0 |
10.0 |
12.2 |
418 (17.4) |
32/14 |
| MACKAY M.O |
31.1 |
+1.5 |
23.3 |
-0.1 |
-- |
0.0 |
-- |
11.2 |
320 (13.3) |
24/02 |
| ROCKHAMPTON AERO |
36.6 |
+5.3 |
22.0 |
-0.1 |
21.1 |
0.0 |
7.2 |
-- |
193 ( 8.0) |
35/16 |
| BUNDABERG AERO |
31.7 |
+1.8 |
21.1 |
-0.3 |
-- |
0.0 |
6.4 |
-- |
221 ( 9.2) |
34/14 |
| NAMBOUR DPI |
34.4 |
+5.6 |
19.5 |
-0.2 |
-- |
0.0 |
2.6 |
-- |
-- |
-- |
| COOLANGATTA |
29.6 |
+1.4 |
23.2 |
+2.4 |
-- |
0.0 |
-- |
-- |
332 (13.8) |
50/13 |
| BRISBANE AERO |
31.1 |
+2.0 |
20.5 |
-0.6 |
-- |
0.0 |
7.8 |
9.9 |
347 (14.5) |
43/15 |
| TOOWOOMBA AIRPORT |
34.9 |
+7.5 |
19.2 |
+1.6 |
-- |
0.0 |
-- |
-- |
349 (14.5) |
54/18 |
| GUNNEDAH (DIPNR) |
31.8 |
+0.7 |
19.3 |
+0.7 |
9.5 |
22.4 |
10.2 |
-- |
316 (13.2) |
-- |
| COFFS HARBOUR MO |
26.2 |
-0.6 |
22.5 |
+3.0 |
20.0 |
0.0 |
7.8 |
4.1 |
605 (25.2) |
55/06 |
| PORT MACQUARIE AIRPORT AWS |
25.6 |
-1.9 |
21.4 |
+3.1 |
-- |
0.0 |
-- |
-- |
-- |
-- |
| WILLIAMTOWN RAAF |
25.6 |
-1.9 |
20.2 |
+2.1 |
18.7 |
5.2 |
8.8 |
8.5 |
433 (18.0) |
55/01 |
| GOSFORD (NARARA RESEARCH STATION) AWS |
25.1 |
-2.0 |
16.0 |
-1.1 |
15.0 |
0.0 |
-- |
-- |
161 ( 6.7) |
39/11 |
| ORANGE AGRICULTURAL INSTITUTE |
22.4 |
-3.4 |
7.2 |
-5.9 |
-1.0 |
1.2 |
7.6 |
12.4 |
-- |
-- |
| DUBBO AIRPORT AWS |
28.9 |
-3.1 |
10.8 |
-6.9 |
-- |
0.0 |
-- |
-- |
-- |
-- |
| SYDNEY AIRPORT AMO |
24.5 |
-1.8 |
18.7 |
-0.3 |
12.8 |
0.0 |
11.0 |
9.8 |
654 (27.3) |
50/00 |
| RICHMOND RAAF |
28.3 |
-0.7 |
11.4 |
-6.2 |
-- |
0.0 |
-- |
-- |
348 (14.5) |
39/15 |
| BELLAMBI AWS |
22.5 |
-2.3 |
16.8 |
-2.3 |
-- |
0.0 |
-- |
-- |
562 (23.4) |
52/23 |
| CANBERRA AIRPORT |
25.2 |
-1.9 |
6.2 |
-6.9 |
2.0 |
0.0 |
10.8 |
12.9 |
481 (20.0) |
39/16 |
| WAGGA WAGGA AMO |
25.8 |
-5.1 |
9.4 |
-6.9 |
5.8 |
0.0 |
9.2 |
13.1 |
-- |
45/16 |
| ALBURY AIRPORT AWS |
25.1 |
-6.2 |
8.5 |
-7.6 |
-- |
1.0 |
-- |
-- |
-- |
-- |
| MILDURA AIRPORT |
26.0 |
-5.6 |
10.4 |
-6.0 |
8.7 |
0.0 |
11.0 |
12.8 |
452 (18.8) |
30/15 |
| TATURA INST SUSTAINABLE AG |
22.8 |
-6.7 |
6.6 |
-7.7 |
5.9 |
0.0 |
6.8 |
-- |
424 (17.7) |
37/15 |
| BENDIGO AIRPORT |
22.8 |
-6.6 |
9.5 |
-4.6 |
-- |
0.0 |
-- |
-- |
457 (19.0) |
�
37/13 |
| MELBOURNE REGIONAL OFFICE |
20.9 |
-4.9 |
13.2 |
-1.4 |
10.9 |
19.0 |
3.4 |
-- |
157 ( 6.5) |
21/09 |
| GEELONG AIRPORT |
19.4 |
-5.6 |
11.8 |
-1.6 |
-- |
0.6 |
-- |
-- |
446 (18.6) |
41/14 |
| BALLARAT AERODROME |
19.9 |
-5.1 |
6.8 |
-4.6 |
-- |
6.0 |
-- |
-- |
401 (16.7) |
43/17 |
| LAUNCESTON (TI TREE BEND) |
22.7 |
-1.7 |
8.1 |
-3.9 |
-- |
5.0 |
-- |
-- |
136 ( 5.7) |
30/17 |
| HOBART AIRPORT |
18.3 |
-4.0 |
12.3 |
+0.3 |
10.1 |
3.8 |
2.6 |
5.1 |
454 (18.9) |
52/15 |
| |
Max
°
C |
+/- norm
°
C |
Min
°
C |
+/- norm
°
C |
Grass Min
°
C |
Rain to 9am mm |
Evaporation to 9am mm |
Sunshine hours |
Wind Run to 9am km |
Maximum Gust km/h / hour of occurrence |
|
| Hottest |
| Highest maximum temperature> | Greatest variation above normal maximum |
Highest minimum temperature | Greatest variation above normal minimum |
40.0 WINTON AIRPORT Northwest QLD
39.9 ISISFORD POST OFFICE Central West QLD
39.4 WINTON POST OFFICE Northwest QLD
39.4 BOULIA AIRPORT Channel Country QLD
39.1 LONGREACH AERO Central West QLD
|
+7.5 : 34.9 TOOWOOMBA AIRPORT Darling Downs E QLD
+7.0 : 37.7 UNIVERSITY OF QUEENSLAND GATTON Brisbane/SE Coast QLD
+6.7 : 34.0 JIMNA FORESTRY Brisbane/SE Coast QLD
+6.6 : 37.0 AMBERLEY AMO Brisbane/SE Coast QLD
+6.5 : 36.4 OAKEY AERO Darling Downs E QLD
|
28.4 ALYANGULA POLICE N Rivers NT
28.4 NGAYAWILI N Rivers NT
28.3 CENTRE ISLAND N Rivers NT
28.2 MORNINGTON ISLAND Gulf Country QLD
28.2 CAMOOWEAL TOWNSHIP Northwest QLD
|
+5.3 : 25.3 TAMBO POST OFFICE Central Highlands QLD
+5.0 : 26.4 CHARLEVILLE AERO Warrego QLD
+4.8 : 27.2 ISISFORD POST OFFICE Central West QLD
+4.8 : 24.0 CARNAMAH Central West WA
+4.6 : 28.2 CAMOOWEAL TOWNSHIP Northwest QLD
|
| Coldest |
| Lowest maximum temperature | Greatest variation below normal maximum |
Lowest minimum temperature | Greatest variation below normal minimum |
4.9 MT BAW BAW W Gippsland VIC
6.0 MOUNT READ W Coast TAS
6.6 MOUNT WELLINGTON Southeast TAS
8.7 MOUNT BULLER Upper NE VIC
9.2 HARTZ MOUNTAIN (KEOGHS PIMPLE) Southeast TAS
|
-11.8 : 4.9 MT BAW BAW W Gippsland VIC
-9.6 : 17.3 EILDON FIRE TOWER N Central VIC
-9.3 : 28.4 WITTENOOM W Pilbara WA
-9.1 : 13.2 MAYDENA POST OFFICE Derwent Valley TAS
-8.9 : 18.4 STRATHBOGIE Lower NE VIC
|
-1.7 THREDBO AWS Snowy Mtns NSW
-1.0 PERISHER VALLEY SKI CENTRE Snowy Mtns NSW
-1.0 MT HOTHAM Upper NE VIC
-0.8 FALLS CREEK Upper NE VIC
-0.6 MT HOTHAM AIRPORT Upper NE VIC
|
**S** -12.1 : 4.2 GULGONG POST OFFICE C Tablelands N NSW
-11.9 : 4.8 CAMDEN AIRPORT AWS Illawarra NSW
-11.6 : 4.5 EYRE Eucla WA
-9.7 : 5.8 WUDINNA AERO W Agricultural SA
-9.6 : 3.0 NERRIGA COMPOSITE South Coast NSW
|
|
Sunniest &
dullest |
Windiest |
Highest gusts |
Todays highest rainfall totals for the 24 hours to 9am. It
includes the top 5 totals nationally followed by all reported falls of 50mm or more. |
Highest
and lowest recordings of hours of sunshine for the 24 hours to midnight. |
Highest wind
run totals in kilometres for the 24 hours to 9am (average speed in brackets).
All reported runs >
=25km/h are shown. |
Highest wind
gusts in km/h for the 24 hours to midnight followed by the hour in which it occurred.
All stations with gusts >
89km/h are shown. |
80.4 LAKE BENNETT N Rivers NT
70.0 YALLEEN W Pilbara WA
62.0 WILDMAN RANGERS N Rivers NT
59.2 CURTIN AERO W Kimberley WA
56.2 IRVINEBANK N Coast--Barron QLD
WESTERN AUSTRALIA
W Kimberley
59.2 CURTIN AERO
56.0 DAMPIER DOWNS
W Pilbara
70.0 YALLEEN
E Gascoyne
51.0 WOODLANDS
NORTHERN TERRITORY
N Rivers
80.4 LAKE BENNETT
62.0 WILDMAN RANGERS
QUEENSLAND
N Peninsula
53.8 STRATHMAY STATION
50.2 STRATHBURN STATION
S Peninsula
56.0 LAURA POST OFFICE
51.0 LAKEFIELD NATIONAL PARK
N Coast--Barron
56.2 IRVINEBANK
|
13.1 WAGGA WAGGA AMO SW Slopes S NSW
13.0 COBAR MO Upper Darling NSW
12.9 CANBERRA AIRPORT Goulburn/Monaro NSW
12.8 MILDURA AIRPORT Mallee N VIC
12.7 WOOMERA AERODROME NW Pastoral SA
.....
3.7 BICHENO (COUNCIL DEPOT) E Coast TAS
3.0 BRIAN PASTURES Brisbane/SE Coast QLD
2.6 GILES METEOROLOGICAL OFFICE Interior WA
1.9 STRATHGORDON VILLAGE W Coast TAS
0.0 WARWICK Darling Downs E QLD
|
1284 (53.5) WILSONS PROMONTORY LIGHTHOUSE W Gippsland VIC
1221 (50.9) HOGAN ISLAND Islands ISL
1180 (49.2) CAPE GRIM BAPS N Coast TAS
1037 (43.2) MOUNT WELLINGTON Southeast TAS
1015 (42.3) MOUNT READ W Coast TAS
929 (38.7) GREEN CAPE AWS South Coast NSW
913 (38.0) TASMAN ISLAND Southeast TAS
852 (35.5) THREDBO AWS Snowy Mtns NSW
837 (34.9) FLINDERS ISLAND AIRPORT Flinders Is/Bass St TAS
800 (33.3) MT HOTHAM Upper NE VIC
790 (32.9) NORAH HEAD AWS Hunter Valley NSW
782 (32.6) MARREE AERO NE Pastoral SA
779 (32.5) HARTZ MOUNTAIN (KEOGHS PIMPLE) Southeast TAS
778 (32.4) CAPE LEEUWIN Lower West WA
758 (31.6) BIRDSVILLE AIRPORT Channel Country QLD
754 (31.4) CAPE BRUNY (CAPE BRUNY) Southeast TAS
735 (30.6) CAPE OTWAY LIGHTHOUSE W Coast VIC
715 (29.8) COLAC (MT GELLIBRAND) W Coast VIC
705 (29.4) NEWCASTLE NOBBYS SIGNAL STATION AWS Hunter Valley NSW
698 (29.1) HAMILTON ISLAND AIRPORT Central Coast E QLD
683 (28.5) BOMBALA AWS Goulburn/Monaro NSW
663 (27.6) KING ISLAND AIRPORT King Island TAS
654 (27.3) SYDNEY AIRPORT AMO Sydney--east NSW
653 (27.2) CAPE WILLOUGHBY Yorke Pen/Kanga Is SA
644 (26.8) NEPTUNE ISLAND W Agricultural SA
641 (26.7) MURRURUNDI GAP AWS Hunter Valley NSW
641 (26.7) MAATSUYKER ISLAND LIGHTHOUSE Southeast TAS
639 (26.6) PORT FAIRY AWS W Coast VIC
628 (26.2) LEIGH CREEK AIRPORT NE Pastoral SA
622 (25.9) COONAMBLE AIRPORT AWS CW Plains N NSW
622 (25.9) MT BAW BAW W Gippsland VIC
605 (25.2) COFFS HARBOUR MO MidNorth Coast N NSW
603 (25.1) MOOMBA AIRPORT NE Pastoral SA
|
96/11 TASMAN ISLAND Southeast TAS
94/20 WILSONS PROMONTORY LIGHTHOUSE W Gippsland VIC
81/16 HOGAN ISLAND Islands ISL
80/04 MOUNT WELLINGTON Southeast TAS
78/12 GREEN CAPE AWS South Coast NSW
|
�