|
For notes on how to interpret
the data and quality control issues, see Daily Weather Summary Help.
**S** and **W** precede data flagged by the Bureau as suspicious or wrong
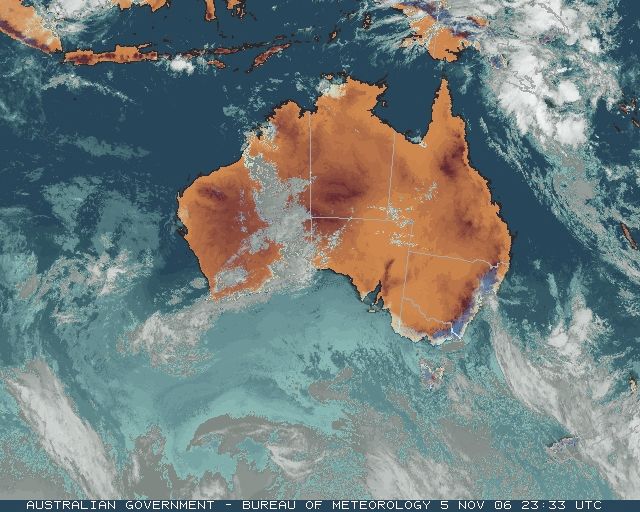
Data is as received at 23:34EST, 14/05/2012.
|
|
| |
Max
°
C |
+/- norm
°
C |
Min
°
C |
+/- norm
°
C |
Grass Min
°
C |
Rain to 9am mm |
Evaporation to 9am mm |
Sunshine hours |
Wind Run to 9am km (24-hour average km/h) |
Maximum Gust km/h / hour of occurrence |
| GERALDTON AIRPORT |
26.2 |
-0.9 |
18.2 |
+4.4 |
17.0 |
0.0 |
8.0 |
-- |
449 (18.7) |
48/12 |
| PERTH AIRPORT |
31.5 |
+5.7 |
19.0 |
+6.4 |
17.2 |
0.4 |
6.0 |
10.3 |
697 (29.0) |
74/05 |
| ALBANY AIRPORT |
20.7 |
-0.1 |
14.9 |
+4.1 |
14.3 |
0.0 |
6.6 |
2.6 |
766 (31.9) |
59/18 |
| BUNBURY |
30.9 |
+6.7 |
16.7 |
+4.7 |
-- |
1.6 |
-- |
-- |
419 (17.5) |
44/13 |
| MANDURAH |
32.1 |
-- |
19.7 |
-- |
-- |
0.0 |
-- |
-- |
435 (18.1) |
55/09 |
| DARWIN AIRPORT |
33.7 |
+0.4 |
22.6 |
-2.7 |
22.5 |
6.6 |
5.0 |
6.8 |
281 (11.7) |
48/06 |
| ALICE SPRINGS AIRPORT |
33.9 |
+0.3 |
15.3 |
-2.6 |
11.8 |
0.0 |
13.0 |
13.0 |
336 (14.0) |
39/11 |
| WHYALLA AERO |
22.1 |
-4.4 |
13.8 |
-0.1 |
-- |
0.0 |
6.0 |
-- |
577 (24.0) |
52/17 |
| ADELAIDE (KENT TOWN) |
22.3 |
-2.8 |
10.6 |
-3.4 |
5.9 |
0.0 |
5.6 |
12.7 |
289 (12.0) |
39/18 |
| MOUNT GAMBIER AERO |
15.4 |
-5.0 |
10.1 |
+1.7 |
8.9 |
0.2 |
4.2 |
0.4 |
626 (26.1) |
48/11 |
| MOUNT ISA AERO |
38.1 |
+1.7 |
18.2 |
-3.2 |
13.8 |
0.0 |
12.4 |
12.5 |
309 (12.9) |
37/14 |
| CAIRNS AERO |
31.6 |
+1.0 |
19.7 |
-2.6 |
17.1 |
0.0 |
9.4 |
12.2 |
362 (15.1) |
34/13 |
| TOWNSVILLE AERO |
32.4 |
+1.6 |
20.4 |
-2.5 |
17.8 |
0.0 |
8.0 |
11.8 |
288 (12.0) |
30/11 |
| MACKAY M.O |
30.6 |
+1.4 |
20.0 |
-1.7 |
-- |
0.0 |
-- |
11.8 |
267 (11.1) |
32/14 |
| ROCKHAMPTON AERO |
34.9 |
+3.7 |
18.5 |
-1.0 |
17.7 |
0.0 |
9.0 |
-- |
246 (10.3) |
35/15 |
| BUNDABERG AERO |
32.7 |
+4.4 |
17.6 |
-1.3 |
-- |
0.0 |
7.0 |
-- |
339 (14.1) |
37/13 |
| NAMBOUR DPI |
31.4 |
+3.4 |
14.2 |
-2.1 |
-- |
0.0 |
2.0 |
-- |
51 ( 2.1) |
26/14 |
| COOLANGATTA |
26.8 |
+1.0 |
16.7 |
-1.5 |
-- |
0.0 |
-- |
-- |
157 ( 6.5) |
37/21 |
| BRISBANE AERO |
28.4 |
+1.6 |
17.2 |
-0.8 |
14.7 |
0.0 |
5.0 |
11.0 |
263 (11.0) |
34/21 |
| TOOWOOMBA AIRPORT |
26.5 |
+0.8 |
14.2 |
-0.3 |
-- |
0.0 |
-- |
-- |
313 (13.0) |
45/11 |
| GUNNEDAH RESOURCE CENTRE |
25.2 |
-3.1 |
15.2 |
+0.2 |
12.9 |
0.0 |
2.6 |
-- |
197 ( 8.2) |
-- |
| COFFS HARBOUR MO |
23.5 |
-1.4 |
16.3 |
+0.2 |
14.1 |
1.0 |
3.2 |
5.3 |
253 (10.5) |
59/16 |
| PORT MACQUARIE AIRPORT AWS |
23.4 |
-1.5 |
14.5 |
-0.5 |
-- |
8.0 |
-- |
-- |
-- |
-- |
| WILLIAMTOWN RAAF |
21.0 |
-4.4 |
15.7 |
+1.4 |
15.6 |
15.8 |
0.2 |
3.7 |
671 (28.0) |
68/05 |
| GOSFORD (NARARA RESEARCH STATION) AWS |
21.3 |
-3.8 |
16.0 |
+2.9 |
16.0 |
14.8 |
-- |
-- |
232 ( 9.7) |
39/07 |
| ORANGE AGRICULTURAL INSTITUTE |
24.0 |
+2.9 |
9.3 |
+0.2 |
5.0 |
0.0 |
2.6 |
12.0 |
-- |
-- |
| DUBBO AIRPORT AWS |
30.2 |
+1.8 |
12.1 |
-1.5 |
-- |
0.0 |
-- |
-- |
-- |
-- |
| SYDNEY AIRPORT AMO |
19.9 |
-4.1 |
16.6 |
+1.3 |
16.2 |
5.8 |
2.0 |
5.0 |
997 (41.5) |
59/00 |
| RICHMOND RAAF |
20.7 |
-5.9 |
15.5 |
+1.6 |
-- |
6.8 |
-- |
-- |
402 (16.8) |
41/08 |
| BELLAMBI AWS |
20.3 |
-1.8 |
15.6 |
0.0 |
-- |
8.8 |
-- |
-- |
827 (34.5) |
59/05 |
| CANBERRA AIRPORT |
20.1 |
-2.6 |
13.6 |
+4.8 |
11.8 |
0.0 |
8.6 |
5.4 |
497 (20.7) |
39/17 |
| WAGGA WAGGA AMO |
29.1 |
+3.4 |
11.0 |
+0.3 |
10.1 |
0.0 |
8.0 |
13.0 |
242 (10.1) |
39/16 |
| ALBURY AIRPORT AWS |
28.1 |
+2.1 |
12.6 |
+1.0 |
-- |
0.0 |
-- |
-- |
218 ( 9.1) |
30/13 |
| MILDURA AIRPORT |
27.5 |
+0.1 |
9.7 |
-2.8 |
8.4 |
0.0 |
9.8 |
13.1 |
391 (16.3) |
39/01 |
| TATURA INST SUSTAINABLE AG |
25.7 |
+1.1 |
11.1 |
+1.0 |
-- |
0.0 |
21.4 |
-- |
431 (18.0) |
44/17 |
| BENDIGO AIRPORT |
23.4 |
-0.8 |
11.0 |
+1.5 |
-- |
0.0 |
-- |
-- |
464 (19.3) |
�
45/17 |
| MELBOURNE REGIONAL OFFICE |
21.3 |
-0.6 |
13.5 |
+2.3 |
12.6 |
0.0 |
4.6 |
-- |
160 ( 6.7) |
24/17 |
| GEELONG AIRPORT |
18.5 |
-2.5 |
13.1 |
+3.5 |
-- |
0.0 |
-- |
-- |
557 (23.2) |
54/14 |
| BALLARAT AERODROME |
20.1 |
+0.5 |
10.1 |
+2.3 |
-- |
0.0 |
-- |
-- |
663 (27.6) |
54/14 |
| LAUNCESTON (TI TREE BEND) |
19.1 |
-1.3 |
8.8 |
-0.1 |
-- |
0.2 |
-- |
-- |
324 (13.5) |
35/23 |
| HOBART AIRPORT |
15.9 |
-3.1 |
6.0 |
-3.2 |
2.9 |
0.0 |
5.0 |
5.7 |
374 (15.6) |
32/13 |
| |
Max
°
C |
+/- norm
°
C |
Min
°
C |
+/- norm
°
C |
Grass Min
°
C |
Rain to 9am mm |
Evaporation to 9am mm |
Sunshine hours |
Wind Run to 9am km |
Maximum Gust km/h / hour of occurrence |
|
| Hottest |
| Highest maximum temperature> | Greatest variation above normal maximum |
Highest minimum temperature | Greatest variation above normal minimum |
40.4 TOORAK RESEARCH STATION Gulf Country QLD
40.3 JULIA CREEK AIRPORT Gulf Country QLD
40.2 WARMUN E Kimberley WA
40.0 KATHERINE AVIATION MUSEUM N Rivers NT
40.0 ARGYLE AERODROME E Kimberley WA
|
+9.8 : 34.5 LANCELIN Lower West WA
+8.1 : 30.9 ROTTNEST ISLAND Lower West WA
+7.8 : 29.1 CAPE NATURALISTE Lower West WA
+7.2 : 32.3 SWANBOURNE Lower West WA
+6.7 : 30.9 BUNBURY Lower West WA
|
29.0 NORTHERN ENDEAVOUR Islands ISL
27.7 SWEERS ISLAND Gulf Country QLD
27.0 ARGYLE AERODROME E Kimberley WA
26.8 PORT KEATS AERO N Rivers NT
26.5 MCCLUER ISLAND N Rivers NT
|
+10.4 : 23.2 DALWALLINU Central West WA
+8.9 : 20.7 GINGIN AERO Lower West WA
+8.6 : 21.0 PEARCE RAAF Lower West WA
+7.2 : 16.0 BRIDGETOWN COMPARISON Lower West WA
+7.2 : 20.5 CARNAMAH Central West WA
|
| Coldest |
| Lowest maximum temperature | Greatest variation below normal maximum |
Lowest minimum temperature | Greatest variation below normal minimum |
4.5 MOUNT WELLINGTON Southeast TAS
7.6 MOUNT READ W Coast TAS
7.9 MT BAW BAW W Gippsland VIC
9.1 LIAWENEE Central Plateau TAS
10.0 HARTZ MOUNTAIN (KEOGHS PIMPLE) Southeast TAS
|
-9.2 : 11.7 COMBIENBAR AWS E Gippsland VIC
-8.5 : 12.4 BOMBALA AWS Goulburn/Monaro NSW
-7.5 : 13.0 HEYWOOD FORESTRY W Coast VIC
-7.3 : 13.8 BOMBALA (THERRY STREET) Goulburn/Monaro NSW
-7.2 : 14.5 NERRIGA COMPOSITE South Coast NSW
-7.2 : 14.8 BRAIDWOOD RACECOURSE AWS South Coast NSW
|
-1.9 MOUNT WELLINGTON Southeast TAS
0.1 TUNNACK FIRE STATION Southeast TAS
0.9 TARRALEAH VILLAGE Derwent Valley TAS
|
-8.6 : 15.2 WAVE HILL N Rivers NT
-6.9 : 16.9 DALY WATERS AWS N Rivers NT
-6.9 : 15.3 RABBIT FLAT N Plateau NT
-6.5 : 17.0 ELLIOTT N Plateau NT
|
|
Sunniest &
dullest |
Windiest |
Highest gusts |
Todays highest rainfall totals for the 24 hours to 9am. It
includes the top 5 totals nationally followed by all reported falls of 50mm or more. |
Highest
and lowest recordings of hours of sunshine for the 24 hours to midnight. |
Highest wind
run totals in kilometres for the 24 hours to 9am (average speed in brackets).
All reported runs >
=25km/h are shown. |
Highest wind
gusts in km/h for the 24 hours to midnight followed by the hour in which it occurred.
All stations with gusts >
89km/h are shown. |
90.0 BROOMAN (CARISBROOK) South Coast NSW
75.0 DALWALLINU Central West WA
64.4 BEAUMONT (THE CEDARS) Illawarra NSW
57.0 JAMBEROO (DRUEWALLA) Illawarra NSW
55.2 WATTAMOLLA (TAMOL) Illawarra NSW
WESTERN AUSTRALIA
N Kimberley
53.4 KALUMBURU
Central West
75.0 DALWALLINU
NEW SOUTH WALES
Hunter Valley
53.2 DUNGOG - MAIN CREEK (YERANDA)
Illawarra
64.4 BEAUMONT (THE CEDARS)
57.0 JAMBEROO (DRUEWALLA)
55.2 WATTAMOLLA (TAMOL)
53.4 JAMBEROO (THE RIDGE)
South Coast
90.0 BROOMAN (CARISBROOK)
|
13.1 MILDURA AIRPORT Mallee N VIC
13.0 ALICE SPRINGS AIRPORT N Plateau NT
13.0 NURIOOTPA VITICULTURAL Adelaide/Lofty SA
13.0 MOREE AERO NW Plains E NSW
13.0 WAGGA WAGGA AMO SW Slopes S NSW
.....
2.6 ALBANY AIRPORT Lower West WA
1.7 GILES METEOROLOGICAL OFFICE Interior WA
1.5 STRATHGORDON VILLAGE W Coast TAS
0.4 MOUNT GAMBIER AERO Lower SE SA
0.2 EAST SALE AIRPORT W Gippsland VIC
|
1294 (53.9) HOGAN ISLAND Islands ISL
1164 (48.5) WILSONS PROMONTORY LIGHTHOUSE W Gippsland VIC
1110 (46.3) MONTAGUE ISLAND LIGHTHOUSE South Coast NSW
1018 (42.4) CAPE WILLOUGHBY Yorke Pen/Kanga Is SA
997 (41.5) SYDNEY AIRPORT AMO Sydney--east NSW
912 (38.0) CAPE LEEUWIN Lower West WA
890 (37.1) NEWCASTLE NOBBYS SIGNAL STATION AWS Hunter Valley NSW
865 (36.0) PARAWA (SECOND VALLEY FOREST AWS) Adelaide/Lofty SA
863 (36.0) CAPE NELSON LIGHTHOUSE W Coast VIC
856 (35.7) HINDMARSH ISLAND AWS Adelaide/Lofty SA
847 (35.3) SWAN ISLAND E Coast TAS
840 (35.0) PORT FAIRY AWS W Coast VIC
827 (34.5) BELLAMBI AWS Illawarra NSW
819 (34.1) NORAH HEAD AWS Hunter Valley NSW
774 (32.3) EDDYSTONE POINT E Coast TAS
766 (31.9) ALBANY AIRPORT Lower West WA
764 (31.8) ULLADULLA AWS South Coast NSW
756 (31.5) EDITHBURGH Yorke Pen/Kanga Is SA
754 (31.4) CAPE NATURALISTE Lower West WA
731 (30.5) NEPTUNE ISLAND W Agricultural SA
714 (29.8) GREEN CAPE AWS South Coast NSW
712 (29.7) STENHOUSE BAY Yorke Pen/Kanga Is SA
711 (29.6) CAPE JAFFA (CURLEY HILLS) Lower SE SA
700 (29.2) WILLIS ISLAND Islands ISL
699 (29.1) EAST SALE AIRPORT W Gippsland VIC
697 (29.0) PERTH AIRPORT Lower West WA
678 (28.3) WARRNAMBOOL AIRPORT NDB W Coast VIC
674 (28.1) PEARCE RAAF Lower West WA
671 (28.0) WILLIAMTOWN RAAF Hunter Valley NSW
663 (27.6) BALLARAT AERODROME Western Plains VIC
659 (27.5) MEEKATHARRA AIRPORT E Gascoyne WA
658 (27.4) MINLATON AERO Yorke Pen/Kanga Is SA
656 (27.3) HOPETOUN NORTH Lower West WA
654 (27.3) HAMILTON AIRPORT W Coast VIC
652 (27.2) KILMORE GAP N Central VIC
650 (27.1) ROBE AIRFIELD Lower SE SA
639 (26.6) CAPE FLATTERY N Coast--Barron QLD
638 (26.6) ESPERANCE Lower West WA
634 (26.4) JACUP Cent Wheatbelt WA
634 (26.4) NULLARBOR W Agricultural SA
629 (26.2) CABRAMURRA SMHEA AWS SW Slopes S NSW
626 (26.1) CHEADANUP Goldfields WA
626 (26.1) MOUNT GAMBIER AERO Lower SE SA
624 (26.0) NORTH SHIELDS (PORT LINCOLN AWS) W Agricultural SA
619 (25.8) MORAWA AIRPORT Central West WA
613 (25.5) GINGIN AERO Lower West WA
610 (25.4) MOUNT MAGNET AERO E Gascoyne WA
600 (25.0) CLEVE AERODROME W Agricultural SA
|
87/10 SAMUEL HILL AERO Central Coast E QLD
81/04 NEWCASTLE NOBBYS SIGNAL STATION AWS Hunter Valley NSW
76/02 NORAH HEAD AWS Hunter Valley NSW
76/23 HOGAN ISLAND Islands ISL
74/05 PERTH AIRPORT Lower West WA
|
�