|
For notes on how to interpret
the data and quality control issues, see Daily Weather Summary Help.
**S** and **W** precede data flagged by the Bureau as suspicious or wrong
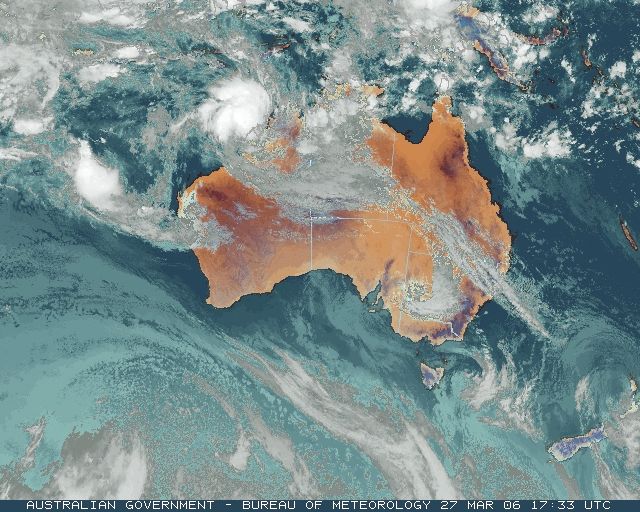
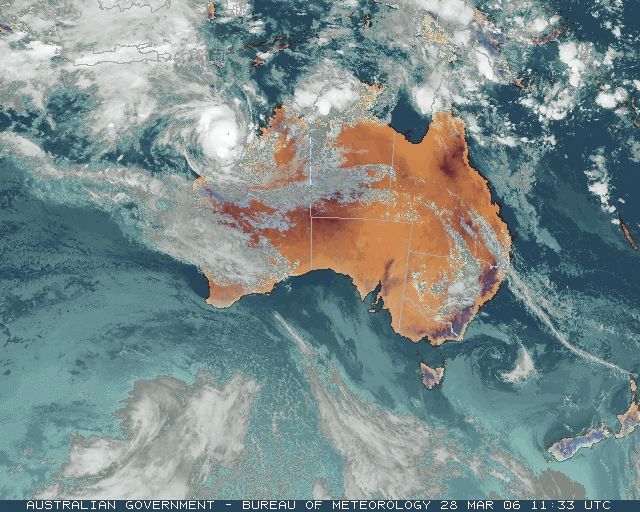
Data is as received at 22:27EST, 14/05/2012.
|
|
| |
Max
°
C |
+/- norm
°
C |
Min
°
C |
+/- norm
°
C |
Grass Min
°
C |
Rain to 9am mm |
Evaporation to 9am mm |
Sunshine hours |
Wind Run to 9am km (24-hour average km/h) |
Maximum Gust km/h / hour of occurrence |
| GERALDTON AIRPORT |
26.8 |
-4.1 |
16.9 |
-1.0 |
15.0 |
0.0 |
8.8 |
-- |
455 (19.0) |
45/21 |
| PERTH AIRPORT |
29.4 |
-0.2 |
11.0 |
-4.8 |
8.0 |
0.0 |
6.4 |
11.0 |
325 (13.5) |
45/22 |
| ALBANY AIRPORT |
20.5 |
-3.6 |
8.5 |
-4.9 |
7.6 |
0.0 |
4.0 |
8.0 |
298 (12.4) |
41/16 |
| BUNBURY |
27.8 |
+0.3 |
10.9 |
-3.1 |
-- |
0.0 |
-- |
-- |
202 ( 8.4) |
50/16 |
| MANDURAH |
26.2 |
-- |
16.4 |
-- |
-- |
0.0 |
-- |
-- |
306 (12.8) |
52/15 |
| DARWIN AIRPORT |
29.9 |
-2.0 |
25.6 |
+1.1 |
25.3 |
1.6 |
6.0 |
1.3 |
326 (13.6) |
26/11 |
| ALICE SPRINGS AIRPORT |
28.1 |
-4.6 |
19.9 |
+2.4 |
17.6 |
0.0 |
11.4 |
3.8 |
374 (15.6) |
41/10 |
| WHYALLA AERO |
21.6 |
-5.7 |
16.9 |
+1.6 |
-- |
1.2 |
5.2 |
-- |
610 (25.4) |
48/02 |
| ADELAIDE (KENT TOWN) |
25.2 |
-1.1 |
15.7 |
+0.5 |
14.7 |
0.0 |
2.2 |
9.5 |
323 (13.5) |
41/03 |
| MOUNT GAMBIER AERO |
23.1 |
0.0 |
10.0 |
-0.5 |
7.8 |
0.4 |
1.6 |
10.4 |
537 (22.4) |
45/11 |
| MOUNT ISA AERO |
34.4 |
+0.1 |
20.6 |
-1.2 |
19.0 |
0.0 |
7.2 |
9.8 |
164 ( 6.8) |
28/12 |
| CAIRNS AERO |
30.8 |
+0.3 |
23.2 |
+0.2 |
22.0 |
1.8 |
3.6 |
7.8 |
430 (17.9) |
43/16 |
| TOWNSVILLE AERO |
30.2 |
-0.5 |
21.1 |
-1.8 |
19.6 |
0.0 |
5.6 |
11.0 |
396 (16.5) |
32/11 |
| MACKAY M.O |
29.4 |
+0.8 |
19.8 |
-2.4 |
-- |
0.0 |
-- |
10.5 |
300 (12.5) |
30/18 |
| ROCKHAMPTON AERO |
31.2 |
+0.7 |
19.7 |
-1.1 |
18.9 |
0.0 |
7.0 |
-- |
279 (11.6) |
28/10 |
| BUNDABERG AERO |
29.4 |
+0.3 |
16.9 |
-3.0 |
-- |
0.0 |
4.6 |
-- |
239 (10.0) |
30/11 |
| NAMBOUR DPI |
27.9 |
0.0 |
15.1 |
-3.1 |
-- |
0.0 |
5.2 |
-- |
-- |
-- |
| COOLANGATTA |
27.1 |
-0.1 |
17.9 |
-1.7 |
-- |
0.0 |
-- |
-- |
206 ( 8.6) |
26/12 |
| BRISBANE AERO |
27.8 |
-0.2 |
17.6 |
-1.7 |
14.3 |
0.0 |
4.8 |
9.7 |
306 (12.8) |
30/15 |
| TOOWOOMBA AIRPORT |
27.5 |
+1.1 |
15.0 |
-1.1 |
-- |
0.0 |
-- |
-- |
329 (13.7) |
41/21 |
| GUNNEDAH (DIPNR) |
31.9 |
+2.8 |
18.2 |
+1.6 |
13.0 |
0.0 |
5.6 |
-- |
102 ( 4.3) |
-- |
| COFFS HARBOUR MO |
26.4 |
+0.5 |
18.2 |
+0.1 |
15.6 |
0.0 |
3.8 |
5.7 |
239 (10.0) |
32/15 |
| PORT MACQUARIE AIRPORT AWS |
26.9 |
+0.6 |
13.6 |
-3.1 |
-- |
0.0 |
-- |
-- |
-- |
-- |
| WILLIAMTOWN RAAF |
27.6 |
+1.4 |
11.9 |
-4.4 |
10.3 |
0.0 |
3.8 |
10.5 |
247 (10.3) |
37/17 |
| GOSFORD (NARARA RESEARCH STATION) AWS |
27.3 |
+1.3 |
12.3 |
-3.0 |
9.6 |
0.0 |
-- |
-- |
72 ( 3.0) |
28/11 |
| ORANGE AGRICULTURAL INSTITUTE |
25.1 |
+2.3 |
10.6 |
0.0 |
6.0 |
0.0 |
4.0 |
3.0 |
-- |
-- |
| DUBBO AIRPORT AWS |
29.0 |
-0.1 |
12.7 |
-1.8 |
-- |
0.0 |
-- |
-- |
-- |
-- |
| SYDNEY AIRPORT AMO |
24.8 |
-0.4 |
18.7 |
+1.3 |
11.2 |
0.0 |
4.4 |
10.1 |
414 (17.3) |
37/19 |
| RICHMOND RAAF |
28.8 |
+1.9 |
12.6 |
-2.9 |
-- |
0.0 |
-- |
-- |
101 ( 4.2) |
39/14 |
| BELLAMBI AWS |
23.8 |
-0.1 |
17.1 |
-0.9 |
-- |
0.0 |
-- |
-- |
338 (14.1) |
41/11 |
| CANBERRA AIRPORT |
25.2 |
+0.7 |
13.1 |
+2.4 |
8.8 |
0.0 |
5.8 |
9.0 |
209 ( 8.7) |
43/18 |
| WAGGA WAGGA AMO |
29.5 |
+1.8 |
15.9 |
+2.5 |
14.6 |
0.0 |
6.2 |
4.9 |
256 (10.7) |
54/23 |
| ALBURY AIRPORT AWS |
30.3 |
+2.4 |
16.0 |
+3.4 |
-- |
0.0 |
-- |
-- |
-- |
-- |
| MILDURA AIRPORT |
26.6 |
-1.7 |
15.8 |
+2.0 |
15.0 |
14.0 |
2.6 |
9.5 |
268 (11.2) |
32/00 |
| TATURA INST SUSTAINABLE AG |
30.0 |
+3.7 |
14.2 |
+2.5 |
13.2 |
0.0 |
5.0 |
-- |
400 (16.7) |
41/00 |
| BENDIGO AIRPORT |
29.0 |
+3.0 |
13.5 |
+2.2 |
-- |
0.0 |
-- |
-- |
470 (19.6) |
�
45/00 |
| MELBOURNE REGIONAL OFFICE |
26.3 |
+2.4 |
16.7 |
+3.5 |
16.6 |
0.0 |
3.6 |
-- |
142 ( 5.9) |
22/17 |
| GEELONG AIRPORT |
22.1 |
-1.1 |
12.0 |
+0.2 |
-- |
0.0 |
-- |
-- |
390 (16.3) |
43/17 |
| BALLARAT AERODROME |
24.4 |
+2.2 |
11.0 |
+1.1 |
-- |
0.0 |
-- |
-- |
-- |
52/00 |
| LAUNCESTON (TI TREE BEND) |
21.0 |
-1.5 |
6.4 |
-3.6 |
-- |
7.0 |
-- |
-- |
291 (12.1) |
30/17 |
| HOBART AIRPORT |
17.6 |
-3.1 |
7.1 |
-3.6 |
5.2 |
0.0 |
3.0 |
8.9 |
469 (19.5) |
28/16 |
| |
Max
°
C |
+/- norm
°
C |
Min
°
C |
+/- norm
°
C |
Grass Min
°
C |
Rain to 9am mm |
Evaporation to 9am mm |
Sunshine hours |
Wind Run to 9am km |
Maximum Gust km/h / hour of occurrence |
|
| Hottest |
| Highest maximum temperature> | Greatest variation above normal maximum |
Highest minimum temperature | Greatest variation above normal minimum |
38.5 ROEBOURNE E Pilbara WA
38.5 ELLIOTT N Plateau NT
37.9 PORT HEDLAND AIRPORT E Pilbara WA
37.5 MARBLE BAR COMPARISON E Pilbara WA
37.5 GASCOYNE JUNCTION W Gascoyne WA
|
+5.4 : 33.6 DUNEDOO POST OFFICE CW Slopes N NSW
+5.2 : 30.2 HOPETOUN NORTH Lower West WA
+5.0 : 27.5 ORANGE AIRPORT COMPARISON C Tablelands S NSW
+4.4 : 29.0 BATHURST AGRICULTURAL STATION C Tablelands S NSW
|
28.4 VARANUS ISLAND Islands ISL
27.5 MANDORA E Pilbara WA
27.3 THEVENARD ISLAND W Pilbara WA
27.2 GASCOYNE JUNCTION W Gascoyne WA
27.0 ROEBOURNE E Pilbara WA
27.0 MARBLE BAR E Pilbara WA
27.0 BARROW ISLAND AIRPORT W Pilbara WA
27.0 CAPE DON N Rivers NT
27.0 MARBLE BAR COMPARISON E Pilbara WA
|
+6.1 : 15.3 COLDSTREAM E Central VIC
+5.7 : 24.5 CUNNAMULLA POST OFFICE Warrego QLD
+5.1 : 22.5 BREWARRINA HOSPITAL Upper Darling NSW
+4.9 : 23.2 MULLEWA Central West WA
+4.9 : 16.0 MORWELL (LATROBE VALLEY AIRPORT) W Gippsland VIC
|
| Coldest |
| Lowest maximum temperature | Greatest variation below normal maximum |
Lowest minimum temperature | Greatest variation below normal minimum |
8.5 MOUNT WELLINGTON Southeast TAS
12.6 LAKE LEAKE (ELIZABETH RIVER) E Coast TAS
13.4 MOUNT READ W Coast TAS
13.9 THREDBO AWS Snowy Mtns NSW
14.0 HARTZ MOUNTAIN (KEOGHS PIMPLE) Southeast TAS
14.0 WARRA W Coast TAS
|
-8.6 : 23.9 KALBARRI Central West WA
-8.4 : 26.7 MURCHISON W Gascoyne WA
-8.3 : 17.8 CLEVE AERODROME W Agricultural SA
-7.8 : 18.1 CLEVE W Agricultural SA
-7.8 : 21.7 WUDINNA AERO W Agricultural SA
|
-4.0 LIAWENEE Central Plateau TAS
-0.8 CHARLOTTE PASS (KOSCIUSKO CHALET) Snowy Mtns NSW
-0.6 MOUNT WELLINGTON Southeast TAS
-0.3 TUNNACK FIRE STATION Southeast TAS
0.3 LAKE LEAKE (ELIZABETH RIVER) E Coast TAS
|
-7.7 : 0.6 GEEVESTON (CEMETERY ROAD) Southeast TAS
-7.6 : -0.3 TUNNACK FIRE STATION Southeast TAS
-7.0 : 1.9 DOVER Southeast TAS
-7.0 : 0.7 OUSE FIRE STATION Derwent Valley TAS
-6.7 : 1.7 BUSHY PARK (BUSHY PARK ESTATES) Derwent Valley TAS
|
|
Sunniest &
dullest |
Windiest |
Highest gusts |
Todays highest rainfall totals for the 24 hours to 9am. It
includes the top 5 totals nationally followed by all reported falls of 50mm or more. |
Highest
and lowest recordings of hours of sunshine for the 24 hours to midnight. |
Highest wind
run totals in kilometres for the 24 hours to 9am (average speed in brackets).
All reported runs >
=25km/h are shown. |
Highest wind
gusts in km/h for the 24 hours to midnight followed by the hour in which it occurred.
All stations with gusts >
89km/h are shown. |
144.0 ALYANGULA POLICE N Rivers NT
102.0 SPALDING (BUNDALEER RESERVOIR) Lower North SA
96.0 CAPE WILBERFORCE N Rivers NT
95.6 TIMBER CREEK N Rivers NT
94.2 SPALDING Lower North SA
WESTERN AUSTRALIA
N Kimberley
69.2 KURI BAY
W Kimberley
76.0 CAPE LEVEQUE
59.0 MIDDLE LAGOON
56.2 CYGNET BAY
NORTHERN TERRITORY
N Rivers
144.0 ALYANGULA POLICE
96.0 CAPE WILBERFORCE
95.6 TIMBER CREEK
85.6 MATARANKA STATION
84.0 BRADSHAW
76.2 WILLEROO
74.0 YIRRKALA TROPICAL GARDENS
72.0 KILLARNEY
71.8 GOVE AIRPORT
66.8 WAVE HILL
65.0 BAN BAN SPRINGS
63.0 AUVERGNE
58.2 TANDANGLE HILL
51.0 RIVEREN
50.0 ALCAN MINESITE
SOUTH AUSTRALIA
Lower North
102.0 SPALDING (BUNDALEER RESERVOIR)
94.2 SPALDING
72.8 GEORGETOWN
72.0 GULNARE
64.4 HUDDLESTON (WILLOW PONDS)
62.6 YACKA
QUEENSLAND
N Peninsula
75.0 SUDLEY STATION
|
11.0 PERTH AIRPORT Lower West WA
11.0 TOWNSVILLE AERO N Coast--Herbert QLD
10.6 ADELAIDE AIRPORT Adelaide/Lofty SA
10.6 SCONE SCS Hunter Valley NSW
10.5 MACKAY M.O Central Coast E QLD
10.5 WILLIAMTOWN RAAF Hunter Valley NSW
.....
1.3 DARWIN AIRPORT N Rivers NT
1.1 BICHENO (COUNCIL DEPOT) E Coast TAS
0.3 BROOME AIRPORT W Kimberley WA
0.0 GOVE AIRPORT N Rivers NT
0.0 EAST SALE AIRPORT W Gippsland VIC
|
1108 (46.2) CAPE WILLOUGHBY Yorke Pen/Kanga Is SA
888 (37.0) EDDYSTONE POINT E Coast TAS
858 (35.8) STENHOUSE BAY Yorke Pen/Kanga Is SA
829 (34.5) NEPTUNE ISLAND W Agricultural SA
828 (34.5) PARAWA (SECOND VALLEY FOREST AWS) Adelaide/Lofty SA
821 (34.2) CAPE GRIM BAPS N Coast TAS
797 (33.2) EDITHBURGH Yorke Pen/Kanga Is SA
749 (31.2) LOW ISLES LIGHTHOUSE N Coast--Barron QLD
736 (30.7) CAPE FLATTERY N Coast--Barron QLD
721 (30.0) WOOMERA AERODROME NW Pastoral SA
703 (29.3) CAPE JAFFA (CURLEY HILLS) Lower SE SA
698 (29.1) HAMILTON ISLAND AIRPORT Central Coast E QLD
694 (28.9) MARREE AERO NE Pastoral SA
693 (28.9) NORTH SHIELDS (PORT LINCOLN AWS) W Agricultural SA
675 (28.1) PORT FAIRY AWS W Coast VIC
667 (27.8) CAPE NELSON LIGHTHOUSE W Coast VIC
640 (26.7) MINLATON AERO Yorke Pen/Kanga Is SA
635 (26.5) SWAN ISLAND E Coast TAS
626 (26.1) NORFOLK ISLAND AERO Islands ISL
614 (25.6) NOARLUNGA Adelaide/Lofty SA
613 (25.5) BIRDSVILLE AIRPORT Channel Country QLD
612 (25.5) ROBE AIRFIELD Lower SE SA
610 (25.4) WHYALLA AERO W Agricultural SA
608 (25.3) LONGERENONG Wimmera S VIC
605 (25.2) HAMILTON AIRPORT W Coast VIC
|
72/17 ROTTNEST ISLAND Lower West WA
68/19 CUNDERDIN AIRFIELD Cent Wheatbelt WA
67/22 WILSONS PROMONTORY LIGHTHOUSE W Gippsland VIC
61/17 GARDEN ISLAND HSF Lower West WA
61/23 CAPE WILLOUGHBY Yorke Pen/Kanga Is SA
61/18 IVANHOE AERODROME AWS Southwest Plains NSW
|
�