|
For notes on how to interpret
the data and quality control issues, see Daily Weather Summary Help.
**S** and **W** precede data flagged by the Bureau as suspicious or wrong
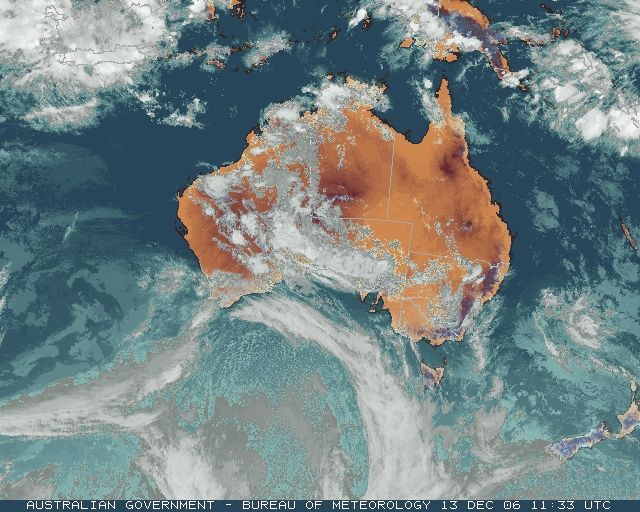
Data is as received at 23:45EST, 14/05/2012.
|
|
| |
Max
°
C |
+/- norm
°
C |
Min
°
C |
+/- norm
°
C |
Grass Min
°
C |
Rain to 9am mm |
Evaporation to 9am mm |
Sunshine hours |
Wind Run to 9am km (24-hour average km/h) |
Maximum Gust km/h / hour of occurrence |
| GERALDTON AIRPORT |
26.7 |
-2.8 |
19.7 |
+3.4 |
18.4 |
0.0 |
10.2 |
-- |
592 (24.7) |
55/14 |
| PERTH AIRPORT |
29.8 |
+0.9 |
16.0 |
+1.2 |
14.1 |
0.0 |
12.4 |
12.5 |
-- |
45/15 |
| ALBANY AIRPORT |
20.9 |
-2.2 |
11.3 |
-1.1 |
9.0 |
0.0 |
8.0 |
5.7 |
316 (13.2) |
45/13 |
| BUNBURY |
29.7 |
+2.6 |
12.2 |
-1.1 |
-- |
0.0 |
-- |
-- |
324 (13.5) |
48/16 |
| MANDURAH |
25.3 |
-- |
17.5 |
-- |
-- |
0.0 |
-- |
-- |
465 (19.4) |
52/15 |
| DARWIN AIRPORT |
33.4 |
+0.8 |
26.8 |
+1.5 |
26.5 |
0.0 |
7.6 |
8.5 |
279 (11.6) |
74/19 |
| ALICE SPRINGS AIRPORT |
40.7 |
+5.3 |
21.3 |
+1.1 |
17.9 |
0.0 |
15.2 |
12.0 |
286 (11.9) |
46/10 |
| WHYALLA AERO |
38.5 |
+10.4 |
11.9 |
-3.9 |
-- |
0.0 |
13.0 |
-- |
333 (13.9) |
61/17 |
| ADELAIDE (KENT TOWN) |
34.2 |
+7.2 |
14.4 |
-1.1 |
9.8 |
0.0 |
8.2 |
10.7 |
312 (13.0) |
45/11 |
| MOUNT GAMBIER AERO |
30.5 |
+7.6 |
6.0 |
-3.9 |
1.9 |
0.0 |
6.2 |
11.2 |
413 (17.2) |
45/14 |
| MOUNT ISA AERO |
39.6 |
+2.4 |
22.9 |
-0.2 |
19.3 |
0.0 |
13.4 |
12.7 |
373 (15.5) |
43/11 |
| CAIRNS AERO |
30.9 |
-0.5 |
23.8 |
+0.4 |
21.7 |
1.2 |
6.2 |
11.4 |
546 (22.8) |
43/09 |
| TOWNSVILLE AERO |
30.7 |
-0.8 |
23.1 |
-1.0 |
20.8 |
0.0 |
7.6 |
12.4 |
473 (19.7) |
43/12 |
| MACKAY M.O |
28.7 |
-1.4 |
21.3 |
-1.6 |
-- |
0.6 |
-- |
10.6 |
320 (13.3) |
34/08 |
| ROCKHAMPTON AERO |
32.2 |
+0.1 |
20.9 |
-0.3 |
19.9 |
0.0 |
8.8 |
-- |
292 (12.2) |
34/16 |
| BUNDABERG AERO |
29.6 |
+0.2 |
19.7 |
-0.8 |
-- |
0.0 |
6.6 |
-- |
337 (14.0) |
37/16 |
| NAMBOUR DPI |
28.1 |
-1.1 |
18.7 |
+0.5 |
-- |
0.2 |
6.4 |
-- |
93 ( 3.9) |
41/12 |
| COOLANGATTA |
27.1 |
-0.1 |
20.0 |
+0.1 |
-- |
1.0 |
-- |
-- |
276 (11.5) |
34/00 |
| BRISBANE AERO |
28.3 |
0.0 |
20.4 |
+0.3 |
19.7 |
0.0 |
6.0 |
10.9 |
401 (16.7) |
34/13 |
| TOOWOOMBA AIRPORT |
26.8 |
-0.9 |
15.8 |
-0.9 |
-- |
25.6 |
-- |
-- |
609 (25.4) |
46/21 |
| GUNNEDAH RESOURCE CENTRE |
34.1 |
+3.1 |
15.5 |
-2.0 |
11.0 |
1.4 |
5.4 |
-- |
318 (13.3) |
-- |
| COFFS HARBOUR MO |
25.6 |
-0.7 |
19.0 |
+0.9 |
17.3 |
0.0 |
6.8 |
10.6 |
559 (23.3) |
37/08 |
| PORT MACQUARIE AIRPORT AWS |
26.4 |
-0.2 |
17.4 |
+0.7 |
-- |
0.8 |
-- |
-- |
-- |
-- |
| WILLIAMTOWN RAAF |
23.1 |
-4.1 |
15.9 |
-0.6 |
15.6 |
3.2 |
0.6 |
6.1 |
356 (14.8) |
34/16 |
| GOSFORD (NARARA RESEARCH STATION) AWS |
23.5 |
-3.4 |
14.5 |
-0.8 |
15.7 |
1.4 |
-- |
-- |
111 ( 4.6) |
26/17 |
| ORANGE AGRICULTURAL INSTITUTE |
27.5 |
+3.1 |
10.5 |
-0.8 |
8.3 |
0.0 |
4.0 |
10.0 |
-- |
-- |
| DUBBO AIRPORT AWS |
34.3 |
+2.8 |
15.7 |
-0.2 |
-- |
2.0 |
-- |
-- |
-- |
-- |
| SYDNEY AIRPORT AMO |
25.8 |
+0.1 |
16.8 |
-0.7 |
16.0 |
0.0 |
3.8 |
4.9 |
556 (23.2) |
48/19 |
| RICHMOND RAAF |
27.1 |
-1.6 |
14.0 |
-2.0 |
-- |
0.4 |
-- |
-- |
240 (10.0) |
39/17 |
| BELLAMBI AWS |
22.6 |
-1.5 |
15.1 |
-2.4 |
-- |
0.0 |
-- |
-- |
421 (17.5) |
43/18 |
| CANBERRA AIRPORT |
28.3 |
+2.2 |
10.9 |
-0.5 |
10.0 |
0.0 |
3.8 |
7.1 |
373 (15.5) |
39/14 |
| WAGGA WAGGA AMO |
31.9 |
+2.5 |
14.6 |
+0.9 |
13.7 |
0.0 |
9.2 |
11.6 |
462 (19.3) |
52/01 |
| ALBURY AIRPORT AWS |
31.5 |
+2.1 |
13.3 |
-0.4 |
-- |
0.0 |
-- |
-- |
201 ( 8.4) |
39/10 |
| MILDURA AIRPORT |
31.8 |
+1.7 |
12.6 |
-2.2 |
9.5 |
0.0 |
9.8 |
11.8 |
339 (14.1) |
26/16 |
| TATURA INST SUSTAINABLE AG |
27.9 |
+0.5 |
8.3 |
-3.9 |
-- |
0.0 |
7.2 |
-- |
399 (16.6) |
28/23 |
| BENDIGO AIRPORT |
27.2 |
+0.2 |
8.9 |
-2.6 |
-- |
0.0 |
-- |
-- |
462 (19.3) |
�
30/16 |
| MELBOURNE REGIONAL OFFICE |
26.3 |
+2.1 |
9.7 |
-3.2 |
7.8 |
0.0 |
5.4 |
-- |
173 ( 7.2) |
17/00 |
| GEELONG AIRPORT |
28.1 |
+5.2 |
6.8 |
-4.1 |
-- |
0.0 |
-- |
-- |
343 (14.3) |
30/13 |
| BALLARAT AERODROME |
25.6 |
+3.0 |
7.6 |
-1.8 |
-- |
0.0 |
-- |
-- |
673 (28.0) |
52/01 |
| LAUNCESTON (TI TREE BEND) |
21.2 |
-1.2 |
7.2 |
-3.4 |
-- |
0.0 |
-- |
-- |
204 ( 8.5) |
39/13 |
| HOBART AIRPORT |
22.0 |
+1.4 |
6.7 |
-4.0 |
3.6 |
0.0 |
5.8 |
10.1 |
369 (15.4) |
37/20 |
| |
Max
°
C |
+/- norm
°
C |
Min
°
C |
+/- norm
°
C |
Grass Min
°
C |
Rain to 9am mm |
Evaporation to 9am mm |
Sunshine hours |
Wind Run to 9am km |
Maximum Gust km/h / hour of occurrence |
|
| Hottest |
| Highest maximum temperature> | Greatest variation above normal maximum |
Highest minimum temperature | Greatest variation above normal minimum |
43.0 WULUNGURRU N Plateau NT
42.9 BIRDSVILLE AIRPORT Channel Country QLD
42.7 BEDOURIE POLICE STATION Channel Country QLD
42.6 URANDANGI Northwest QLD
42.2 OODNADATTA AIRPORT NE Pastoral SA
42.2 YULARA AERO N Plateau NT
|
+12.2 : 37.0 EUCLA Eucla WA
+11.7 : 37.0 EYRE Eucla WA
+10.4 : 38.5 WHYALLA AERO W Agricultural SA
+9.8 : 33.4 EDITHBURGH Yorke Pen/Kanga Is SA
+9.2 : 28.0 WILSONS PROMONTORY LIGHTHOUSE W Gippsland VIC
|
29.9 WATARRKA N Plateau NT
29.4 BROOME AIRPORT W Kimberley WA
28.9 MCCLUER ISLAND N Rivers NT
28.8 WULUNGURRU N Plateau NT
28.2 CENTRE ISLAND N Rivers NT
|
+7.9 : 29.9 WATARRKA N Plateau NT
+6.4 : 26.9 KULGERA N Plateau NT
+6.2 : 27.3 WARBURTON AIRFIELD Interior WA
+5.7 : 27.6 GILES METEOROLOGICAL OFFICE Interior WA
+5.0 : 18.8 YORK Cent Wheatbelt WA
|
| Coldest |
| Lowest maximum temperature | Greatest variation below normal maximum |
Lowest minimum temperature | Greatest variation below normal minimum |
13.1 MOUNT WELLINGTON Southeast TAS
14.7 MT HOTHAM Upper NE VIC
15.4 THREDBO AWS Snowy Mtns NSW
15.4 FALLS CREEK Upper NE VIC
15.4 MOUNT READ W Coast TAS
|
-7.1 : 31.8 NEWMAN AERO E Gascoyne WA
-7.0 : 30.3 CARNEGIE Interior WA
-5.6 : 16.0 POINT WILSON W Central VIC
-5.5 : 34.7 PARABURDOO AERO E Gascoyne WA
-5.4 : 32.3 TOM PRICE W Pilbara WA
|
-1.6 LAKE ST CLAIR NATIONAL PARK Central Plateau TAS
-1.2 LIAWENEE Central Plateau TAS
-0.6 PERISHER VALLEY SKI CENTRE Snowy Mtns NSW
-0.5 MOUNT WELLINGTON Southeast TAS
-0.4 TUNNACK FIRE STATION Southeast TAS
|
-9.3 : 2.5 FLINDERS ISLAND AIRPORT Flinders Is/Bass St TAS
-8.4 : 2.5 KING ISLAND AIRPORT King Island TAS
-7.9 : 10.3 WILCANNIA (REID ST) Far Northwest NSW
-7.8 : 10.8 WILCANNIA AERODROME AWS Far Northwest NSW
**S** -7.8 : 7.1 GULGONG POST OFFICE C Tablelands N NSW
-7.8 : -0.4 TUNNACK FIRE STATION Southeast TAS
-7.8 : 0.8 OUSE FIRE STATION Derwent Valley TAS
|
|
Sunniest &
dullest |
Windiest |
Highest gusts |
Todays highest rainfall totals for the 24 hours to 9am. It
includes the top 5 totals nationally followed by all reported falls of 50mm or more. |
Highest
and lowest recordings of hours of sunshine for the 24 hours to midnight. |
Highest wind
run totals in kilometres for the 24 hours to 9am (average speed in brackets).
All reported runs >
=25km/h are shown. |
Highest wind
gusts in km/h for the 24 hours to midnight followed by the hour in which it occurred.
All stations with gusts >
89km/h are shown. |
79.0 SOUTHWELL STATION N Peninsula QLD
72.0 TOSARI Darling Downs E QLD
71.8 DEVERTON SAWPIT GULLY RD Brisbane/SE Coast QLD
67.0 BAMAGA N Peninsula QLD
65.0 NAVILLOWEEN Darling Downs E QLD
NORTHERN TERRITORY
N Rivers
54.6 GROOTE EYLANDT AIRPORT AWS
QUEENSLAND
N Peninsula
79.0 SOUTHWELL STATION
67.0 BAMAGA
Brisbane/SE Coast
71.8 DEVERTON SAWPIT GULLY RD
Darling Downs E
72.0 TOSARI
65.0 NAVILLOWEEN
62.0 CARRAMAR
62.0 MURRALAH
61.0 PITTSWORTH
56.0 PALGROVE
56.0 ROSALIE PLAINS
53.4 VICTORIA HILL
53.0 LEYBURN POST OFFICE
51.8 JONDARYAN POST OFFICE
NEW SOUTH WALES
N Tablelands W
58.4 GLEN INNES POST OFFICE
|
13.2 GROVE (COMPARISON) Southeast TAS
12.7 MOUNT ISA AERO Gulf Country QLD
12.5 PERTH AIRPORT Lower West WA
12.4 TOWNSVILLE AERO N Coast--Herbert QLD
12.0 ALICE SPRINGS AIRPORT N Plateau NT
.....
4.9 SYDNEY AIRPORT AMO Sydney--east NSW
4.4 BUNDOORA (LATROBE UNIVERSITY) E Central VIC
3.2 EAST SALE AIRPORT W Gippsland VIC
2.3 MELBOURNE AIRPORT E Central VIC
0.4 LAKE EILDON N Central VIC
|
1019 (42.5) MAATSUYKER ISLAND LIGHTHOUSE Southeast TAS
866 (36.1) ROTTNEST ISLAND Lower West WA
795 (33.1) LOW ISLES LIGHTHOUSE N Coast--Barron QLD
773 (32.2) MURRURUNDI GAP AWS Hunter Valley NSW
729 (30.4) CAPE WILLOUGHBY Yorke Pen/Kanga Is SA
714 (29.8) HAMILTON ISLAND AIRPORT Central Coast E QLD
703 (29.3) GARDEN ISLAND HSF Lower West WA
673 (28.0) BALLARAT AERODROME Western Plains VIC
664 (27.7) STENHOUSE BAY Yorke Pen/Kanga Is SA
655 (27.3) KILMORE GAP N Central VIC
643 (26.8) CAPE JAFFA (CURLEY HILLS) Lower SE SA
622 (25.9) NEPTUNE ISLAND W Agricultural SA
616 (25.7) MINLATON AERO Yorke Pen/Kanga Is SA
609 (25.4) TOOWOOMBA AIRPORT Darling Downs E QLD
604 (25.2) CAPE NATURALISTE Lower West WA
604 (25.2) SCONE AIRPORT AWS Hunter Valley NSW
|
118/11 MT BAW BAW W Gippsland VIC
93/20 FORREST Eucla WA
85/21 GUNNEDAH AIRPORT AWS NW Slopes S NSW
80/22 NARRABRI AIRPORT AWS NW Slopes N NSW
74/19 DARWIN AIRPORT N Rivers NT
74/20 WOOMERA AERODROME NW Pastoral SA
|
�