|
For notes on how to interpret
the data and quality control issues, see Daily Weather Summary Help.
**S** and **W** precede data flagged by the Bureau as suspicious or wrong
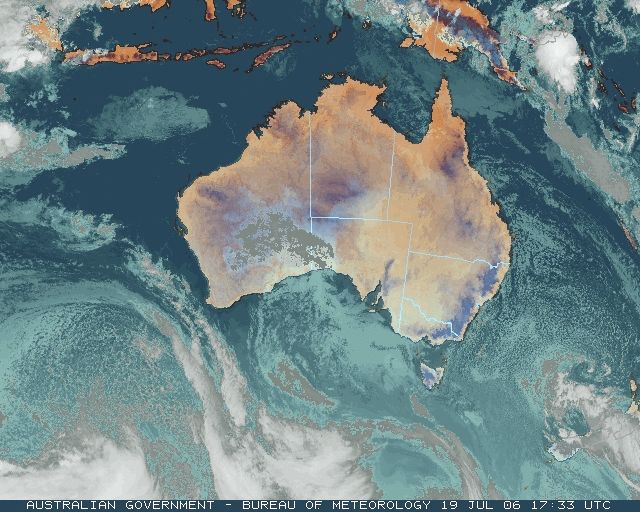
Data is as received at 23:02EST, 14/05/2012.
|
|
| |
Max
°
C |
+/- norm
°
C |
Min
°
C |
+/- norm
°
C |
Grass Min
°
C |
Rain to 9am mm |
Evaporation to 9am mm |
Sunshine hours |
Wind Run to 9am km (24-hour average km/h) |
Maximum Gust km/h / hour of occurrence |
| GERALDTON AIRPORT |
21.7 |
+2.2 |
6.3 |
-3.2 |
1.9 |
0.0 |
4.2 |
-- |
367 (15.3) |
58/21 |
| PERTH AIRPORT |
21.4 |
+3.5 |
2.9 |
-5.2 |
1.2 |
0.0 |
2.4 |
6.6 |
281 (11.7) |
61/22 |
| ALBANY AIRPORT |
18.2 |
+2.4 |
1.5 |
-6.0 |
-1.4 |
0.0 |
3.0 |
5.2 |
245 (10.2) |
63/22 |
| BUNBURY |
16.9 |
-0.3 |
1.9 |
-5.3 |
-- |
0.0 |
-- |
-- |
182 ( 7.6) |
52/16 |
| MANDURAH |
17.1 |
-- |
10.1 |
-- |
-- |
0.0 |
-- |
-- |
268 (11.2) |
72/14 |
| DARWIN AIRPORT |
28.5 |
-2.0 |
13.6 |
-5.6 |
11.3 |
0.0 |
4.0 |
11.1 |
314 (13.1) |
37/09 |
| ALICE SPRINGS AIRPORT |
15.4 |
-4.3 |
9.2 |
+5.2 |
8.9 |
0.0 |
2.6 |
3.5 |
405 (16.9) |
30/11 |
| WHYALLA AERO |
13.6 |
-3.3 |
0.2 |
-5.1 |
-- |
0.0 |
4.0 |
-- |
149 ( 6.2) |
22/11 |
| ADELAIDE (KENT TOWN) |
14.4 |
-0.9 |
2.2 |
-5.3 |
-2.0 |
0.0 |
3.0 |
9.4 |
126 ( 5.3) |
26/11 |
| MOUNT GAMBIER AERO |
11.6 |
-1.5 |
1.4 |
-3.8 |
-2.1 |
0.0 |
0.8 |
9.6 |
260 (10.8) |
37/11 |
| MOUNT ISA AERO |
23.2 |
-1.5 |
6.5 |
-2.1 |
2.5 |
0.0 |
4.2 |
10.5 |
311 (13.0) |
32/10 |
| CAIRNS AERO |
25.6 |
-0.1 |
13.5 |
-3.5 |
11.4 |
0.0 |
6.4 |
10.8 |
473 (19.7) |
34/16 |
| TOWNSVILLE AERO |
20.4 |
-4.7 |
10.0 |
-3.6 |
8.2 |
0.0 |
4.4 |
0.0 |
268 (11.2) |
26/12 |
| MACKAY M.O |
20.1 |
-1.2 |
15.4 |
+2.6 |
-- |
1.4 |
-- |
5.6 |
529 (22.0) |
52/14 |
| ROCKHAMPTON AERO |
22.1 |
-1.0 |
11.8 |
+2.3 |
9.4 |
0.0 |
4.0 |
-- |
284 (11.8) |
39/11 |
| BUNDABERG AERO |
20.5 |
-1.5 |
11.2 |
+1.1 |
-- |
0.0 |
2.4 |
-- |
489 (20.4) |
39/09 |
| NAMBOUR DPI |
20.1 |
-1.0 |
11.9 |
+4.2 |
-- |
0.0 |
2.8 |
-- |
-- |
-- |
| COOLANGATTA |
18.2 |
-2.3 |
11.8 |
+1.9 |
-- |
0.0 |
-- |
-- |
613 (25.5) |
41/02 |
| BRISBANE AERO |
20.0 |
-0.9 |
8.9 |
+0.1 |
6.5 |
0.0 |
4.8 |
6.2 |
405 (16.9) |
39/09 |
| TOOWOOMBA AIRPORT |
16.4 |
-0.2 |
3.8 |
-2.5 |
-- |
0.0 |
-- |
-- |
324 (13.5) |
41/10 |
| GUNNEDAH (DIPNR) |
14.2 |
-1.9 |
3.8 |
-0.9 |
-0.7 |
0.0 |
2.6 |
-- |
255 (10.6) |
-- |
| COFFS HARBOUR MO |
18.5 |
-0.2 |
11.7 |
+4.2 |
7.8 |
0.0 |
4.2 |
8.8 |
627 (26.1) |
45/16 |
| PORT MACQUARIE AIRPORT AWS |
16.9 |
-1.8 |
7.0 |
+0.7 |
-- |
0.0 |
-- |
-- |
-- |
-- |
| WILLIAMTOWN RAAF |
13.8 |
-3.2 |
8.1 |
+1.8 |
7.3 |
4.8 |
0.2 |
2.2 |
382 (15.9) |
48/15 |
| GOSFORD (NARARA RESEARCH STATION) AWS |
14.9 |
-2.6 |
7.7 |
+3.1 |
7.3 |
4.8 |
-- |
-- |
77 ( 3.2) |
30/12 |
| ORANGE AGRICULTURAL INSTITUTE |
9.6 |
+0.3 |
-0.5 |
-1.9 |
-4.0 |
0.0 |
1.0 |
8.0 |
-- |
-- |
| DUBBO AIRPORT AWS |
14.6 |
-0.6 |
1.4 |
-1.6 |
-- |
0.0 |
-- |
-- |
-- |
-- |
| SYDNEY AIRPORT AMO |
14.9 |
-2.1 |
7.4 |
+0.3 |
4.7 |
14.2 |
1.4 |
4.8 |
606 (25.3) |
67/13 |
| RICHMOND RAAF |
16.0 |
-1.4 |
4.1 |
+0.6 |
-- |
0.0 |
-- |
-- |
245 (10.2) |
35/13 |
| BELLAMBI AWS |
13.8 |
-3.0 |
8.8 |
-1.2 |
-- |
0.2 |
-- |
-- |
516 (21.5) |
67/13 |
| CANBERRA AIRPORT |
11.6 |
+0.3 |
-1.2 |
-1.1 |
-5.9 |
0.0 |
2.0 |
8.2 |
292 (12.2) |
37/15 |
| WAGGA WAGGA AMO |
13.8 |
+1.1 |
-0.2 |
-2.9 |
-2.3 |
0.0 |
1.4 |
9.8 |
221 ( 9.2) |
18/10 |
| ALBURY AIRPORT AWS |
13.4 |
+0.4 |
-0.7 |
-3.9 |
-- |
0.0 |
-- |
-- |
96 ( 4.0) |
28/10 |
| MILDURA AIRPORT |
14.3 |
-1.0 |
2.4 |
-1.9 |
0.1 |
0.0 |
1.6 |
7.9 |
248 (10.3) |
28/14 |
| TATURA INST SUSTAINABLE AG |
13.5 |
+0.5 |
-2.1 |
-5.0 |
-- |
0.0 |
1.4 |
-- |
212 ( 8.8) |
21/12 |
| BENDIGO AIRPORT |
12.0 |
-0.5 |
0.6 |
-1.8 |
-- |
0.2 |
-- |
-- |
310 (12.9) |
�
26/12 |
| MELBOURNE REGIONAL OFFICE |
13.7 |
+0.3 |
4.4 |
-1.6 |
2.5 |
0.0 |
1.2 |
-- |
188 ( 7.8) |
15/13 |
| GEELONG AIRPORT |
12.0 |
-1.8 |
2.1 |
-3.3 |
-- |
0.0 |
-- |
-- |
251 (10.5) |
37/11 |
| BALLARAT AERODROME |
10.6 |
+0.6 |
2.8 |
-0.4 |
-- |
0.2 |
-- |
-- |
533 (22.2) |
39/07 |
| LAUNCESTON (TI TREE BEND) |
12.1 |
-0.5 |
-0.6 |
-2.8 |
-- |
0.0 |
-- |
-- |
110 ( 4.6) |
28/13 |
| HOBART AIRPORT |
12.2 |
-0.2 |
3.7 |
-0.4 |
-0.5 |
0.0 |
0.8 |
6.6 |
276 (11.5) |
28/08 |
| |
Max
°
C |
+/- norm
°
C |
Min
°
C |
+/- norm
°
C |
Grass Min
°
C |
Rain to 9am mm |
Evaporation to 9am mm |
Sunshine hours |
Wind Run to 9am km |
Maximum Gust km/h / hour of occurrence |
|
| Hottest |
| Highest maximum temperature> | Greatest variation above normal maximum |
Highest minimum temperature | Greatest variation above normal minimum |
31.6 OENPELLI N Rivers NT
31.5 JABIRU AIRPORT N Rivers NT
**W** 31.0 PORT KEATS AERO N Rivers NT
30.6 WEIPA AERO N Peninsula QLD
30.2 BATCHELOR AERO N Rivers NT
|
+4.7 : 21.0 HYDEN Cent Wheatbelt WA
+4.3 : 19.0 KATANNING Cent Wheatbelt WA
+4.2 : 18.7 KATANNING COMPARISON Cent Wheatbelt WA
+4.1 : 20.5 KELLERBERRIN Cent Wheatbelt WA
+3.9 : 19.2 CORRIGIN Cent Wheatbelt WA
|
24.0 NORTHERN ENDEAVOUR Islands ISL
23.6 COCONUT ISLAND N Peninsula QLD
23.2 HORN ISLAND N Peninsula QLD
23.0 COCOS ISLAND AIRPORT Islands ISL
22.2 CHRISTMAS ISLAND AERO Islands ISL
|
+6.8 : 10.5 CURTIN SPRINGS N Plateau NT
+5.3 : 10.8 WARBURTON AIRFIELD Interior WA
+5.2 : 9.2 ALICE SPRINGS AIRPORT N Plateau NT
+4.9 : 8.9 CESSNOCK AIRPORT AWS Hunter Valley NSW
|
| Coldest |
| Lowest maximum temperature | Greatest variation below normal maximum |
Lowest minimum temperature | Greatest variation below normal minimum |
-2.5 THREDBO AWS Snowy Mtns NSW
-0.7 MT HOTHAM Upper NE VIC
-0.5 CHARLOTTE PASS (KOSCIUSKO CHALET) Snowy Mtns NSW
-0.5 FALLS CREEK Upper NE VIC
0.0 PERISHER VALLEY SKI CENTRE Snowy Mtns NSW
|
-7.3 : 11.1 ERNABELLA (PUKATJA) NW Pastoral SA
-5.5 : 16.3 WOOLSHED Central Coast E QLD
-5.5 : 19.3 CHARTERS TOWERS AIRPORT Central Coast W QLD
-5.2 : 7.7 MT NOWA NOWA E Gippsland VIC
|
-8.7 THREDBO AWS Snowy Mtns NSW
-8.5 PERISHER VALLEY SKI CENTRE Snowy Mtns NSW
-6.3 LIAWENEE Central Plateau TAS
-6.0 MT HOTHAM Upper NE VIC
-5.5 CRESSY RESEARCH STATION N Coast TAS
|
-9.1 : 6.2 CURTIN AERO W Kimberley WA
-8.1 : -1.7 GINGIN AERO Lower West WA
-8.0 : -1.7 FLINDERS ISLAND AIRPORT Flinders Is/Bass St TAS
-8.0 : -3.0 NARACOORTE AERODROME Lower SE SA
-7.9 : -2.5 NORTHAM Cent Wheatbelt WA
|
|
Sunniest &
dullest |
Windiest |
Highest gusts |
Todays highest rainfall totals for the 24 hours to 9am. It
includes the top 5 totals nationally followed by all reported falls of 50mm or more. |
Highest
and lowest recordings of hours of sunshine for the 24 hours to midnight. |
Highest wind
run totals in kilometres for the 24 hours to 9am (average speed in brackets).
All reported runs >
=25km/h are shown. |
Highest wind
gusts in km/h for the 24 hours to midnight followed by the hour in which it occurred.
All stations with gusts >
89km/h are shown. |
37.2 PREMER POST OFFICE NW Slopes S NSW
32.4 YELLANUP Lower West WA
31.6 LAKE PRESTON LODGE 2 COMP. Lower West WA
31.2 DENMARK AGRIC. SCHOOL Lower West WA
28.4 BRONTE SURF CLUB Sydney--east NSW
|
11.1 DARWIN AIRPORT N Rivers NT
10.9 BROOME AIRPORT W Kimberley WA
10.8 CAIRNS AERO N Coast--Barron QLD
10.7 TENNANT CREEK AIRPORT N Plateau NT
10.7 RABBIT FLAT N Plateau NT
.....
2.2 WILLIAMTOWN RAAF Hunter Valley NSW
1.7 GILES METEOROLOGICAL OFFICE Interior WA
1.7 LAKE LEAKE (ELIZABETH RIVER) E Coast TAS
0.4 LIAWENEE Central Plateau TAS
0.0 TOWNSVILLE AERO N Coast--Herbert QLD
|
1311 (54.6) DOUBLE ISLAND POINT LIGHTHOUSE Brisbane/SE Coast QLD
1019 (42.5) CAPE MORETON LIGHTHOUSE Brisbane/SE Coast QLD
931 (38.8) HERON ISLAND RES STN Wide Bay/Burnett QLD
926 (38.6) HAMILTON ISLAND AIRPORT Central Coast E QLD
923 (38.5) RUNDLE ISLAND Wide Bay/Burnett QLD
910 (37.9) LOW ISLES LIGHTHOUSE N Coast--Barron QLD
903 (37.6) CAPE FLATTERY N Coast--Barron QLD
771 (32.1) GREEN CAPE AWS South Coast NSW
770 (32.1) LADY ELLIOT ISLAND Wide Bay/Burnett QLD
729 (30.4) LORD HOWE ISLAND AERO Islands ISL
717 (29.9) COCONUT ISLAND N Peninsula QLD
711 (29.6) BYRON BAY (CAPE BYRON AWS) North Coast NSW
710 (29.6) COCOS ISLAND AIRPORT Islands ISL
692 (28.8) CAPE WILLOUGHBY Yorke Pen/Kanga Is SA
666 (27.8) MAROOCHYDORE AERO Brisbane/SE Coast QLD
660 (27.5) NEPTUNE ISLAND W Agricultural SA
657 (27.4) MURRURUNDI GAP AWS Hunter Valley NSW
649 (27.0) LOOKOUT HILL Western Plains VIC
638 (26.6) HORN ISLAND N Peninsula QLD
627 (26.1) EVANS HEAD RAAF BOMBING RANGE AWS North Coast NSW
627 (26.1) COFFS HARBOUR MO MidNorth Coast N NSW
613 (25.5) COOLANGATTA Brisbane/SE Coast QLD
606 (25.3) SYDNEY AIRPORT AMO Sydney--east NSW
|
98/22 ROTTNEST ISLAND Lower West WA
91/22 SWANBOURNE Lower West WA
85/22 GARDEN ISLAND HSF Lower West WA
81/11 CAPE NATURALISTE Lower West WA
81/00 LOOKOUT HILL Western Plains VIC
|
�