|
For notes on how to interpret
the data and quality control issues, see Daily Weather Summary Help.
**S** and **W** precede data flagged by the Bureau as suspicious or wrong
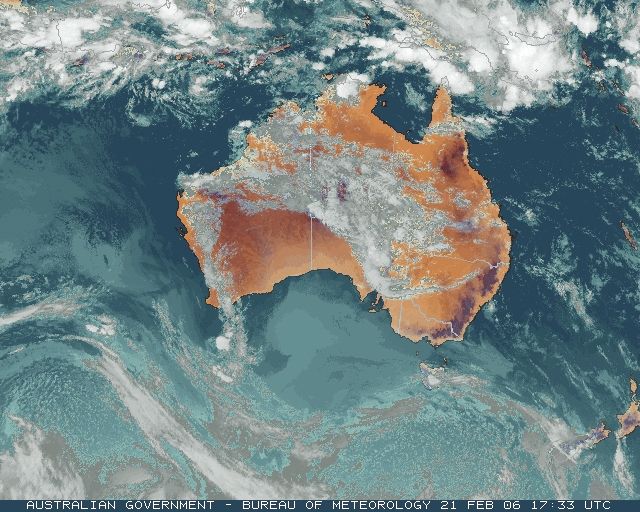
Data is as received at 22:17EST, 14/05/2012.
|
|
| |
Max
°
C |
+/- norm
°
C |
Min
°
C |
+/- norm
°
C |
Grass Min
°
C |
Rain to 9am mm |
Evaporation to 9am mm |
Sunshine hours |
Wind Run to 9am km (24-hour average km/h) |
Maximum Gust km/h / hour of occurrence |
| GERALDTON AIRPORT |
35.5 |
+3.0 |
22.9 |
+3.8 |
19.9 |
0.0 |
11.2 |
-- |
454 (18.9) |
37/12 |
| PERTH AIRPORT |
32.3 |
+0.5 |
18.7 |
+1.3 |
18.4 |
9.8 |
6.2 |
12.3 |
386 (16.1) |
32/15 |
| ALBANY AIRPORT |
33.3 |
+8.4 |
19.6 |
+5.2 |
17.1 |
0.2 |
9.8 |
8.6 |
518 (21.6) |
43/00 |
| BUNBURY |
25.4 |
-4.4 |
19.5 |
+3.9 |
-- |
0.2 |
-- |
-- |
303 (12.6) |
28/11 |
| MANDURAH |
27.4 |
-- |
20.7 |
-- |
-- |
0.0 |
-- |
-- |
339 (14.1) |
34/15 |
| DARWIN AIRPORT |
29.2 |
-2.2 |
23.4 |
-1.3 |
23.4 |
1.2 |
5.2 |
0.7 |
320 (13.3) |
46/06 |
| ALICE SPRINGS AIRPORT |
31.6 |
-3.5 |
24.1 |
+3.3 |
23.3 |
0.0 |
19.0 |
2.7 |
563 (23.5) |
50/15 |
| WHYALLA AERO |
27.2 |
-2.4 |
18.1 |
+0.4 |
-- |
0.0 |
7.2 |
-- |
592 (24.7) |
34/09 |
| ADELAIDE (KENT TOWN) |
32.3 |
+3.0 |
14.8 |
-2.3 |
10.7 |
0.0 |
1.0 |
11.8 |
208 ( 8.7) |
24/09 |
| MOUNT GAMBIER AERO |
26.8 |
+1.7 |
14.8 |
+3.2 |
15.1 |
0.0 |
5.0 |
9.9 |
535 (22.3) |
41/11 |
| MOUNT ISA AERO |
36.3 |
+1.0 |
26.7 |
+3.3 |
24.7 |
0.0 |
10.6 |
10.0 |
361 (15.0) |
37/01 |
| CAIRNS AERO |
31.8 |
+0.6 |
24.8 |
+1.1 |
23.5 |
0.2 |
9.6 |
9.9 |
489 (20.4) |
43/13 |
| TOWNSVILLE AERO |
33.1 |
+2.0 |
25.1 |
+1.0 |
23.0 |
1.8 |
7.0 |
11.1 |
490 (20.4) |
48/13 |
| MACKAY M.O |
30.0 |
+0.4 |
24.5 |
+1.1 |
-- |
3.6 |
-- |
4.8 |
451 (18.8) |
59/14 |
| ROCKHAMPTON AERO |
33.3 |
+2.0 |
23.0 |
+0.9 |
22.4 |
0.4 |
10.0 |
-- |
427 (17.8) |
43/14 |
| BUNDABERG AERO |
31.4 |
+1.5 |
21.1 |
-0.3 |
-- |
0.0 |
7.2 |
-- |
464 (19.3) |
55/16 |
| NAMBOUR DPI |
28.7 |
-0.1 |
20.5 |
+0.8 |
-- |
16.6 |
4.2 |
-- |
-- |
-- |
| COOLANGATTA |
28.7 |
+0.5 |
22.0 |
+1.2 |
-- |
25.8 |
-- |
-- |
352 (14.7) |
44/16 |
| BRISBANE AERO |
30.6 |
+1.5 |
21.7 |
+0.6 |
19.8 |
2.0 |
6.6 |
9.5 |
346 (14.4) |
45/15 |
| TOOWOOMBA AIRPORT |
27.3 |
-0.1 |
18.1 |
+0.5 |
-- |
0.0 |
-- |
-- |
645 (26.9) |
54/15 |
| GUNNEDAH (DIPNR) |
32.7 |
+1.6 |
19.8 |
+1.2 |
16.9 |
0.0 |
10.0 |
-- |
270 (11.3) |
-- |
| COFFS HARBOUR MO |
27.6 |
+0.8 |
20.2 |
+0.7 |
18.1 |
3.6 |
5.6 |
10.7 |
306 (12.8) |
26/10 |
| PORT MACQUARIE AIRPORT AWS |
28.1 |
+0.6 |
17.6 |
-0.7 |
-- |
0.0 |
-- |
-- |
-- |
-- |
| WILLIAMTOWN RAAF |
25.6 |
-1.9 |
17.8 |
-0.3 |
17.6 |
12.6 |
1.0 |
2.1 |
75 ( 3.1) |
-- |
| GOSFORD (NARARA RESEARCH STATION) AWS |
26.8 |
-0.3 |
14.8 |
-2.3 |
13.3 |
0.0 |
-- |
-- |
121 ( 5.0) |
21/11 |
| ORANGE AGRICULTURAL INSTITUTE |
27.5 |
+1.7 |
12.1 |
-1.0 |
7.0 |
0.0 |
7.2 |
11.3 |
-- |
-- |
| DUBBO AIRPORT AWS |
32.6 |
+0.6 |
18.8 |
+1.1 |
-- |
0.0 |
-- |
-- |
-- |
-- |
| SYDNEY AIRPORT AMO |
26.8 |
+0.5 |
20.3 |
+1.3 |
13.9 |
0.0 |
7.8 |
8.1 |
367 (15.3) |
32/15 |
| RICHMOND RAAF |
29.0 |
0.0 |
16.9 |
-0.7 |
-- |
0.0 |
-- |
-- |
147 ( 6.1) |
39/16 |
| BELLAMBI AWS |
26.5 |
+1.7 |
20.1 |
+1.0 |
-- |
0.0 |
-- |
-- |
243 (10.1) |
24/16 |
| CANBERRA AIRPORT |
31.1 |
+4.0 |
17.7 |
+4.6 |
16.5 |
0.0 |
6.8 |
10.3 |
344 (14.3) |
45/16 |
| WAGGA WAGGA AMO |
35.8 |
+4.9 |
19.6 |
+3.3 |
18.7 |
0.0 |
8.2 |
12.5 |
267 (11.1) |
50/22 |
| ALBURY AIRPORT AWS |
35.8 |
+4.5 |
17.9 |
+1.8 |
-- |
0.0 |
-- |
-- |
-- |
-- |
| MILDURA AIRPORT |
35.9 |
+4.3 |
16.2 |
-0.2 |
14.3 |
0.0 |
7.8 |
11.1 |
321 (13.4) |
34/17 |
| TATURA INST SUSTAINABLE AG |
32.3 |
+2.8 |
14.6 |
+0.3 |
13.5 |
0.0 |
7.4 |
-- |
394 (16.4) |
39/23 |
| BENDIGO AIRPORT |
30.8 |
+1.4 |
14.9 |
+0.8 |
-- |
0.0 |
-- |
-- |
485 (20.2) |
�
45/08 |
| MELBOURNE REGIONAL OFFICE |
23.9 |
-1.9 |
17.1 |
+2.5 |
15.9 |
0.0 |
5.0 |
-- |
178 ( 7.4) |
24/10 |
| GEELONG AIRPORT |
21.0 |
-4.0 |
16.4 |
+3.0 |
-- |
0.0 |
-- |
-- |
344 (14.3) |
44/16 |
| BALLARAT AERODROME |
24.7 |
-0.3 |
13.3 |
+1.9 |
-- |
0.0 |
-- |
-- |
707 (29.5) |
59/21 |
| LAUNCESTON (TI TREE BEND) |
25.2 |
+0.8 |
11.9 |
-0.1 |
-- |
0.0 |
-- |
-- |
189 ( 7.9) |
35/15 |
| HOBART AIRPORT |
17.0 |
-5.3 |
13.8 |
+1.8 |
13.0 |
0.0 |
4.6 |
0.9 |
532 (22.2) |
35/16 |
| |
Max
°
C |
+/- norm
°
C |
Min
°
C |
+/- norm
°
C |
Grass Min
°
C |
Rain to 9am mm |
Evaporation to 9am mm |
Sunshine hours |
Wind Run to 9am km |
Maximum Gust km/h / hour of occurrence |
|
| Hottest |
| Highest maximum temperature> | Greatest variation above normal maximum |
Highest minimum temperature | Greatest variation above normal minimum |
40.4 HOPETOUN NORTH Lower West WA
39.8 BALLERA GAS FIELD Far SW QLD
39.6 KELLERBERRIN Cent Wheatbelt WA
39.4 CAMOOWEAL TOWNSHIP Northwest QLD
39.3 CUNDERDIN AIRFIELD Cent Wheatbelt WA
|
+14.6 : 40.4 HOPETOUN NORTH Lower West WA
+9.8 : 37.2 JACUP Cent Wheatbelt WA
+9.3 : 35.5 ESPERANCE Lower West WA
+9.3 : 37.2 ONGERUP Cent Wheatbelt WA
+9.1 : 37.5 RAVENSTHORPE Cent Wheatbelt WA
|
29.0 BALLERA GAS FIELD Far SW QLD
28.1 BEDOURIE POLICE STATION Channel Country QLD
27.9 MOOMBA AIRPORT NE Pastoral SA
27.7 BIRDSVILLE AIRPORT Channel Country QLD
27.3 WINDORAH POST OFFICE Channel Country QLD
|
+9.3 : 23.6 ONGERUP Cent Wheatbelt WA
+9.0 : 23.0 KATANNING Cent Wheatbelt WA
+8.8 : 21.9 ROCKY GULLY Lower West WA
+8.8 : 22.6 KATANNING COMPARISON Cent Wheatbelt WA
+8.5 : 23.0 RAVENSTHORPE Cent Wheatbelt WA
|
| Coldest |
| Lowest maximum temperature | Greatest variation below normal maximum |
Lowest minimum temperature | Greatest variation below normal minimum |
9.8 MOUNT WELLINGTON Southeast TAS
12.5 HARTZ MOUNTAIN (KEOGHS PIMPLE) Southeast TAS
13.0 WARRA W Coast TAS
14.3 TASMAN ISLAND Southeast TAS
14.3 MOUNT READ W Coast TAS
|
-12.6 : 22.0 ERNABELLA (PUKATJA) NW Pastoral SA
-11.6 : 25.0 OODNADATTA AIRPORT NE Pastoral SA
-10.0 : 27.1 YULARA AERO N Plateau NT
-9.3 : 24.0 ARKAROOLA NE Pastoral SA
-9.1 : 27.4 CURTIN SPRINGS N Plateau NT
|
5.0 EYRE Eucla WA
5.5 PERISHER VALLEY SKI CENTRE Snowy Mtns NSW
6.2 MOUNT WELLINGTON Southeast TAS
7.6 MT HOTHAM AIRPORT Upper NE VIC
|
-11.1 : 5.0 EYRE Eucla WA
-6.1 : 9.4 WUDINNA AERO W Agricultural SA
-6.0 : 9.6 COULTA (COLES POINT) W Agricultural SA
-5.8 : 8.8 ROSEWORTHY AG COLLEGE Adelaide/Lofty SA
-5.6 : 11.2 FORREST Eucla WA
|
|
Sunniest &
dullest |
Windiest |
Highest gusts |
Todays highest rainfall totals for the 24 hours to 9am. It
includes the top 5 totals nationally followed by all reported falls of 50mm or more. |
Highest
and lowest recordings of hours of sunshine for the 24 hours to midnight. |
Highest wind
run totals in kilometres for the 24 hours to 9am (average speed in brackets).
All reported runs >
=25km/h are shown. |
Highest wind
gusts in km/h for the 24 hours to midnight followed by the hour in which it occurred.
All stations with gusts >
89km/h are shown. |
97.0 RUSSELL RIVER N Coast--Herbert QLD
95.6 PIRLANGIMPI AWS N Rivers NT
80.8 MCCLUER ISLAND N Rivers NT
74.4 JABIRU AIRPORT N Rivers NT
69.0 SOUTH ALLIGATOR RESORT N Rivers NT
WESTERN AUSTRALIA
W Pilbara
60.4 PANNAWONICA
NORTHERN TERRITORY
N Rivers
95.6 PIRLANGIMPI AWS
80.8 MCCLUER ISLAND
74.4 JABIRU AIRPORT
69.0 SOUTH ALLIGATOR RESORT
52.3 JABIRU COUNCIL
52.0 POINT STUART
QUEENSLAND
N Peninsula
54.8 COCONUT ISLAND
50.0 HEATHLANDS NATIONAL PARK
S Peninsula
63.0 HICKS ISLAND
N Coast--Herbert
97.0 RUSSELL RIVER
Brisbane/SE Coast
51.6 TAROME
|
12.8 ADELAIDE AIRPORT Adelaide/Lofty SA
12.5 WAGGA WAGGA AMO SW Slopes S NSW
12.4 MOREE AERO NW Plains E NSW
12.3 NORFOLK ISLAND AERO Islands ISL
12.3 PERTH AIRPORT Lower West WA
.....
2.1 WILLIAMTOWN RAAF Hunter Valley NSW
0.9 HOBART AIRPORT Southeast TAS
0.7 DARWIN AIRPORT N Rivers NT
0.0 WOOMERA AERODROME NW Pastoral SA
0.0 GROVE (COMPARISON) Southeast TAS
|
1147 (47.8) MAATSUYKER ISLAND LIGHTHOUSE Southeast TAS
1144 (47.7) MOUNT WELLINGTON Southeast TAS
915 (38.1) RUNDLE ISLAND Wide Bay/Burnett QLD
833 (34.7) HAMILTON ISLAND AIRPORT Central Coast E QLD
824 (34.3) HOGAN ISLAND Islands ISL
797 (33.2) LADY ELLIOT ISLAND Wide Bay/Burnett QLD
769 (32.0) CAPE GRIM BAPS N Coast TAS
732 (30.5) CAPE JAFFA (CURLEY HILLS) Lower SE SA
728 (30.3) DOUBLE ISLAND POINT LIGHTHOUSE Brisbane/SE Coast QLD
727 (30.3) CAPE WILLOUGHBY Yorke Pen/Kanga Is SA
724 (30.2) WULUNGURRU N Plateau NT
712 (29.7) CAPE MORETON LIGHTHOUSE Brisbane/SE Coast QLD
707 (29.5) BALLARAT AERODROME Western Plains VIC
705 (29.4) WILSONS PROMONTORY LIGHTHOUSE W Gippsland VIC
688 (28.7) NEPTUNE ISLAND W Agricultural SA
677 (28.2) KILMORE GAP N Central VIC
667 (27.8) HERON ISLAND RES STN Wide Bay/Burnett QLD
664 (27.7) PARAWA (SECOND VALLEY FOREST AWS) Adelaide/Lofty SA
656 (27.3) SCOTTS PEAK DAM W Coast TAS
645 (26.9) TOOWOOMBA AIRPORT Darling Downs E QLD
640 (26.7) EDITHBURGH Yorke Pen/Kanga Is SA
632 (26.3) CEDUNA AMO W Agricultural SA
623 (26.0) ROBE AIRFIELD Lower SE SA
617 (25.7) HARTZ MOUNTAIN (KEOGHS PIMPLE) Southeast TAS
614 (25.6) STENHOUSE BAY Yorke Pen/Kanga Is SA
604 (25.2) HAMILTON AIRPORT W Coast VIC
603 (25.1) BIRDSVILLE AIRPORT Channel Country QLD
602 (25.1) ALVA BEACH Central Coast E QLD
|
81/18 CAPE MORETON LIGHTHOUSE Brisbane/SE Coast QLD
78/02 TOWN OF 1770 Wide Bay/Burnett QLD
70/23 TASMAN ISLAND Southeast TAS
67/17 CAPE FLATTERY N Coast--Barron QLD
67/14 BALLERA GAS FIELD Far SW QLD
67/19 TIBOOBURRA AIRPORT Far Northwest NSW
67/23 MOUNT WELLINGTON Southeast TAS
67/17 MOOMBA AIRPORT NE Pastoral SA
|
�