|
For notes on how to interpret
the data and quality control issues, see Daily Weather Summary Help.
**S** and **W** precede data flagged by the Bureau as suspicious or wrong
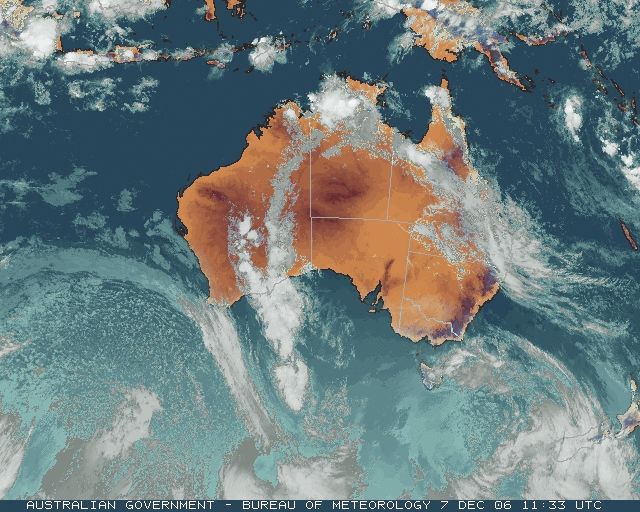
Data is as received at 23:43EST, 14/05/2012.
|
|
| |
Max
°
C |
+/- norm
°
C |
Min
°
C |
+/- norm
°
C |
Grass Min
°
C |
Rain to 9am mm |
Evaporation to 9am mm |
Sunshine hours |
Wind Run to 9am km (24-hour average km/h) |
Maximum Gust km/h / hour of occurrence |
| GERALDTON AIRPORT |
24.9 |
-4.6 |
16.7 |
+0.4 |
14.0 |
0.0 |
8.6 |
-- |
372 (15.5) |
45/13 |
| PERTH AIRPORT |
24.6 |
-4.3 |
14.3 |
-0.5 |
13.5 |
0.0 |
8.0 |
12.2 |
322 (13.4) |
39/13 |
| ALBANY AIRPORT |
26.9 |
+3.8 |
14.1 |
+1.7 |
11.3 |
0.0 |
8.0 |
9.6 |
428 (17.8) |
52/15 |
| BUNBURY |
23.3 |
-3.8 |
10.7 |
-2.6 |
-- |
0.0 |
-- |
-- |
212 ( 8.8) |
37/16 |
| MANDURAH |
22.3 |
-- |
18.6 |
-- |
-- |
0.0 |
-- |
-- |
279 (11.6) |
37/21 |
| DARWIN AIRPORT |
34.6 |
+2.0 |
25.2 |
-0.1 |
25.8 |
0.0 |
6.6 |
8.9 |
463 (19.3) |
37/17 |
| ALICE SPRINGS AIRPORT |
37.8 |
+2.4 |
16.4 |
-3.8 |
11.9 |
0.0 |
13.4 |
12.9 |
354 (14.8) |
55/12 |
| WHYALLA AERO |
28.8 |
+0.7 |
13.0 |
-2.8 |
-- |
0.0 |
11.6 |
-- |
550 (22.9) |
39/18 |
| ADELAIDE (KENT TOWN) |
32.9 |
+5.9 |
11.9 |
-3.6 |
4.8 |
0.0 |
8.0 |
13.4 |
234 ( 9.8) |
39/23 |
| MOUNT GAMBIER AERO |
23.3 |
+0.4 |
2.1 |
-7.8 |
-1.7 |
0.0 |
6.2 |
13.0 |
313 (13.0) |
39/14 |
| MOUNT ISA AERO |
39.0 |
+1.8 |
24.6 |
+1.5 |
20.6 |
0.0 |
13.6 |
9.6 |
336 (14.0) |
50/22 |
| CAIRNS AERO |
27.5 |
-3.9 |
22.6 |
-0.8 |
20.8 |
6.8 |
6.0 |
1.9 |
311 (13.0) |
28/12 |
| TOWNSVILLE AERO |
30.5 |
-1.0 |
24.3 |
+0.2 |
23.0 |
0.2 |
10.0 |
6.5 |
596 (24.8) |
41/11 |
| MACKAY M.O |
28.1 |
-2.0 |
24.0 |
+1.1 |
-- |
0.0 |
-- |
5.3 |
380 (15.8) |
-- |
| ROCKHAMPTON AERO |
29.1 |
-3.0 |
19.0 |
-2.2 |
17.8 |
0.0 |
9.4 |
-- |
362 (15.1) |
37/11 |
| BUNDABERG AERO |
28.5 |
-0.9 |
16.4 |
-4.1 |
-- |
0.0 |
9.4 |
-- |
468 (19.5) |
46/14 |
| NAMBOUR DPI |
25.4 |
-3.8 |
13.3 |
-4.9 |
-- |
0.0 |
2.8 |
-- |
121 ( 5.0) |
30/15 |
| COOLANGATTA |
26.5 |
-0.7 |
13.5 |
-6.4 |
-- |
0.0 |
-- |
-- |
217 ( 9.0) |
35/11 |
| BRISBANE AERO |
26.2 |
-2.1 |
15.0 |
-5.1 |
12.7 |
0.0 |
8.0 |
5.1 |
339 (14.1) |
37/09 |
| TOOWOOMBA AIRPORT |
25.1 |
-2.6 |
13.5 |
-3.2 |
-- |
0.0 |
-- |
-- |
714 (29.8) |
54/23 |
| GUNNEDAH RESOURCE CENTRE |
-- |
-- |
19.7 |
+2.2 |
15.6 |
0.0 |
9.2 |
-- |
120 ( 5.0) |
-- |
| COFFS HARBOUR MO |
25.1 |
-1.2 |
14.9 |
-3.2 |
12.0 |
0.0 |
6.8 |
7.7 |
406 (16.9) |
35/12 |
| PORT MACQUARIE AIRPORT AWS |
25.7 |
-0.9 |
11.9 |
-4.8 |
-- |
0.0 |
-- |
-- |
-- |
-- |
| WILLIAMTOWN RAAF |
26.0 |
-1.2 |
13.9 |
-2.6 |
12.1 |
0.0 |
7.8 |
10.1 |
374 (15.6) |
43/07 |
| GOSFORD (NARARA RESEARCH STATION) AWS |
26.0 |
-0.9 |
15.8 |
+0.5 |
14.0 |
0.0 |
-- |
-- |
145 ( 6.0) |
26/01 |
| ORANGE AGRICULTURAL INSTITUTE |
30.0 |
+5.6 |
8.9 |
-2.4 |
8.9 |
11.8 |
7.8 |
14.0 |
-- |
-- |
| DUBBO AIRPORT AWS |
36.0 |
+4.5 |
16.1 |
+0.2 |
-- |
0.0 |
-- |
-- |
-- |
-- |
| SYDNEY AIRPORT AMO |
25.1 |
-0.6 |
17.8 |
+0.3 |
15.5 |
0.0 |
9.6 |
9.5 |
726 (30.3) |
63/01 |
| RICHMOND RAAF |
31.1 |
+2.4 |
17.9 |
+1.9 |
-- |
0.0 |
-- |
-- |
259 (10.8) |
39/13 |
| BELLAMBI AWS |
22.6 |
-1.5 |
16.9 |
-0.6 |
-- |
0.0 |
-- |
-- |
656 (27.3) |
63/00 |
| CANBERRA AIRPORT |
33.2 |
+7.1 |
9.5 |
-1.9 |
6.5 |
0.0 |
10.8 |
12.2 |
362 (15.1) |
45/12 |
| WAGGA WAGGA AMO |
34.5 |
+5.1 |
13.0 |
-0.7 |
12.5 |
0.0 |
15.0 |
12.5 |
385 (16.0) |
41/13 |
| ALBURY AIRPORT AWS |
32.3 |
+2.9 |
12.7 |
-1.0 |
-- |
0.0 |
-- |
-- |
289 (12.0) |
35/14 |
| MILDURA AIRPORT |
33.4 |
+3.3 |
12.5 |
-2.3 |
9.5 |
0.0 |
11.2 |
13.6 |
376 (15.7) |
32/12 |
| TATURA INST SUSTAINABLE AG |
30.1 |
+2.7 |
9.7 |
-2.5 |
-- |
0.0 |
10.8 |
-- |
501 (20.9) |
41/15 |
| BENDIGO AIRPORT |
31.3 |
+4.3 |
7.9 |
-3.6 |
-- |
0.0 |
-- |
-- |
398 (16.6) |
�
43/17 |
| MELBOURNE REGIONAL OFFICE |
21.7 |
-2.5 |
11.2 |
-1.7 |
9.1 |
0.0 |
6.2 |
-- |
140 ( 5.8) |
21/11 |
| GEELONG AIRPORT |
19.4 |
-3.5 |
5.4 |
-5.5 |
-- |
0.0 |
-- |
-- |
386 (16.1) |
43/15 |
| BALLARAT AERODROME |
25.0 |
+2.4 |
3.9 |
-5.5 |
-- |
0.0 |
-- |
-- |
513 (21.4) |
45/20 |
| LAUNCESTON (TI TREE BEND) |
22.2 |
-0.2 |
9.6 |
-1.0 |
-- |
0.0 |
-- |
-- |
295 (12.3) |
50/13 |
| HOBART AIRPORT |
21.4 |
+0.8 |
12.1 |
+1.4 |
11.0 |
0.4 |
7.2 |
9.2 |
590 (24.6) |
78/12 |
| |
Max
°
C |
+/- norm
°
C |
Min
°
C |
+/- norm
°
C |
Grass Min
°
C |
Rain to 9am mm |
Evaporation to 9am mm |
Sunshine hours |
Wind Run to 9am km |
Maximum Gust km/h / hour of occurrence |
|
| Hottest |
| Highest maximum temperature> | Greatest variation above normal maximum |
Highest minimum temperature | Greatest variation above normal minimum |
44.6 FITZROY CROSSING AERO W Kimberley WA
43.6 WAVE HILL N Rivers NT
43.5 WARMUN E Kimberley WA
43.2 CURTIN AERO W Kimberley WA
43.0 LAJAMANU N Rivers NT
|
+18.2 : 42.5 HOPETOUN NORTH Lower West WA
+15.4 : 39.9 ESPERANCE Lower West WA
+14.7 : 40.3 ESPERANCE AERO Lower West WA
+12.9 : 38.8 JACUP Cent Wheatbelt WA
+12.7 : 40.0 RAVENSTHORPE Cent Wheatbelt WA
|
30.9 KIDMAN SPRINGS N Rivers NT
30.8 WYNDHAM N Kimberley WA
30.2 WARMUN E Kimberley WA
30.2 ARGYLE AERODROME E Kimberley WA
30.0 QUILPIE AIRPORT Far SW QLD
30.0 NORTHERN ENDEAVOUR Islands ISL
|
+7.7 : 30.0 QUILPIE AIRPORT Far SW QLD
+7.6 : 22.6 SOUTHERN CROSS AIRFIELD Goldfields WA
+6.3 : 22.2 BENCUBBIN Cent Wheatbelt WA
+5.7 : 21.2 SOUTHERN CROSS Goldfields WA
+5.6 : 30.9 KIDMAN SPRINGS N Rivers NT
+5.6 : 19.0 ESPERANCE AERO Lower West WA
+5.6 : 19.9 NAREMBEEN Cent Wheatbelt WA
|
| Coldest |
| Lowest maximum temperature | Greatest variation below normal maximum |
Lowest minimum temperature | Greatest variation below normal minimum |
9.9 MOUNT WELLINGTON Southeast TAS
10.0 HARTZ MOUNTAIN (KEOGHS PIMPLE) Southeast TAS
11.7 LAKE ST CLAIR NATIONAL PARK Central Plateau TAS
12.1 MOUNT READ W Coast TAS
12.7 MAATSUYKER ISLAND LIGHTHOUSE Southeast TAS
|
-10.3 : 25.5 BARCALDINE POST OFFICE Central West QLD
-8.3 : 29.2 LONGREACH AERO Central West QLD
-7.4 : 27.5 TAMBO POST OFFICE Central Highlands QLD
-7.3 : 26.0 ROMA AIRPORT Maranoa QLD
-6.8 : 27.0 MITCHELL POST OFFICE Maranoa QLD
-6.8 : 27.1 SURAT Maranoa QLD
|
-0.3 LIAWENEE Central Plateau TAS
0.2 MOUNT WELLINGTON Southeast TAS
0.5 CHARLOTTE PASS (KOSCIUSKO CHALET) Snowy Mtns NSW
0.8 ARARAT PRISON Western Plains VIC
0.8 MORTLAKE RACECOURSE W Coast VIC
|
-9.9 : 0.9 PORTLAND (CASHMORE AIRPORT) W Coast VIC
-9.1 : 1.0 HEYWOOD FORESTRY W Coast VIC
-8.9 : 1.0 NARACOORTE AERODROME Lower SE SA
-8.6 : 1.3 WARRNAMBOOL AIRPORT NDB W Coast VIC
-8.4 : 0.8 ARARAT PRISON Western Plains VIC
|
|
Sunniest &
dullest |
Windiest |
Highest gusts |
Todays highest rainfall totals for the 24 hours to 9am. It
includes the top 5 totals nationally followed by all reported falls of 50mm or more. |
Highest
and lowest recordings of hours of sunshine for the 24 hours to midnight. |
Highest wind
run totals in kilometres for the 24 hours to 9am (average speed in brackets).
All reported runs >
=25km/h are shown. |
Highest wind
gusts in km/h for the 24 hours to midnight followed by the hour in which it occurred.
All stations with gusts >
89km/h are shown. |
88.6 SODA VALLEY STATION Upper Carpentaria QLD
85.0 MOORLANDS Central West QLD
75.0 BARCALDINE DOWNS Central West QLD
75.0 BOGUNDA STATION Central West QLD
73.0 YAPPAR RIVER Gulf Country QLD
NORTHERN TERRITORY
N Rivers
58.0 LAKE EVELLA
QUEENSLAND
Gulf Country
73.0 YAPPAR RIVER
65.0 DELTA DOWNS STATION
Upper Carpentaria
88.6 SODA VALLEY STATION
72.0 TORRENS CREEK POST OFFICE
63.2 ELLENVALE STATION
57.0 LOW HOLM STATION
54.0 GLENDOWER STATION
53.4 MT PLEASANT STATION
N Coast--Barron
57.0 HAPPY VALLEY
N Coast--Herbert
57.0 INNISFAIL WHARF ALERT
55.2 INNISFAIL
51.0 EURAMO TM
Central West
85.0 MOORLANDS
75.0 BARCALDINE DOWNS
75.0 BOGUNDA STATION
61.0 BIRRICANNIA
60.0 SPRINGLEIGH
58.0 HOLMLEIGH
56.5 ABERFOYLE
53.0 LANDSBOROUGH DOWNS
Warrego
65.0 SHERWOOD PARK STATION
|
14.0 ORANGE AGRICULTURAL INSTITUTE C Tablelands S NSW
13.6 ADELAIDE AIRPORT Adelaide/Lofty SA
13.6 MILDURA AIRPORT Mallee N VIC
13.5 CEDUNA AMO W Agricultural SA
13.4 NURIOOTPA VITICULTURAL Adelaide/Lofty SA
13.4 ADELAIDE (KENT TOWN) Adelaide/Lofty SA
.....
5.1 BRISBANE AERO Brisbane/SE Coast QLD
3.2 WARWICK Darling Downs E QLD
1.9 CAIRNS AERO N Coast--Barron QLD
1.1 WALKAMIN DPI N Coast--Barron QLD
0.2 KAIRI RESEARCH STATION N Coast--Barron QLD
|
1412 (58.8) MAATSUYKER ISLAND LIGHTHOUSE Southeast TAS
988 (41.2) HOGAN ISLAND Islands ISL
977 (40.7) MOUNT WELLINGTON Southeast TAS
911 (38.0) LOW HEAD N Coast TAS
890 (37.1) FLINDERS ISLAND AIRPORT Flinders Is/Bass St TAS
842 (35.1) SCOTTS PEAK DAM W Coast TAS
820 (34.2) HAMILTON ISLAND AIRPORT Central Coast E QLD
818 (34.1) RUNDLE ISLAND Wide Bay/Burnett QLD
809 (33.7) CAPE GRIM BAPS N Coast TAS
773 (32.2) WILLIS ISLAND Islands ISL
767 (32.0) WILSONS PROMONTORY LIGHTHOUSE W Gippsland VIC
758 (31.6) HARTZ MOUNTAIN (KEOGHS PIMPLE) Southeast TAS
756 (31.5) TASMAN ISLAND Southeast TAS
751 (31.3) MT BAW BAW W Gippsland VIC
736 (30.7) LADY ELLIOT ISLAND Wide Bay/Burnett QLD
732 (30.5) MONTAGUE ISLAND LIGHTHOUSE South Coast NSW
726 (30.3) SYDNEY AIRPORT AMO Sydney--east NSW
714 (29.8) TOOWOOMBA AIRPORT Darling Downs E QLD
701 (29.2) CAPE BRUNY (CAPE BRUNY) Southeast TAS
698 (29.1) DOUBLE ISLAND POINT LIGHTHOUSE Brisbane/SE Coast QLD
698 (29.1) GREEN CAPE AWS South Coast NSW
680 (28.3) SWAN ISLAND E Coast TAS
679 (28.3) NORAH HEAD AWS Hunter Valley NSW
662 (27.6) NEPTUNE ISLAND W Agricultural SA
661 (27.5) ALVA BEACH Central Coast E QLD
656 (27.3) BELLAMBI AWS Illawarra NSW
655 (27.3) CAPE WILLOUGHBY Yorke Pen/Kanga Is SA
636 (26.5) KILMORE GAP N Central VIC
631 (26.3) CAPE MORETON LIGHTHOUSE Brisbane/SE Coast QLD
625 (26.0) HERON ISLAND RES STN Wide Bay/Burnett QLD
622 (25.9) MOUNT READ W Coast TAS
611 (25.5) EDITHBURGH Yorke Pen/Kanga Is SA
610 (25.4) PARAWA (SECOND VALLEY FOREST AWS) Adelaide/Lofty SA
610 (25.4) MOUNT CRAWFORD FIRE TOWER Adelaide/Lofty SA
|
122/10 MAATSUYKER ISLAND LIGHTHOUSE Southeast TAS
120/11 MOUNT WELLINGTON Southeast TAS
111/15 ESPERANCE Lower West WA
111/15 HARTZ MOUNTAIN (KEOGHS PIMPLE) Southeast TAS
102/09 SCOTTS PEAK DAM W Coast TAS
94/16 MOUNT MAGNET AERO E Gascoyne WA
93/18 CENTURY MINE Gulf Country QLD
|
�