|
For notes on how to interpret
the data and quality control issues, see Daily Weather Summary Help.
**S** and **W** precede data flagged by the Bureau as suspicious or wrong
Data is as received at 23:19EST, 14/05/2012.
|
|
| |
Max
°
C |
+/- norm
°
C |
Min
°
C |
+/- norm
°
C |
Grass Min
°
C |
Rain to 9am mm |
Evaporation to 9am mm |
Sunshine hours |
Wind Run to 9am km (24-hour average km/h) |
Maximum Gust km/h / hour of occurrence |
| GERALDTON AIRPORT |
22.3 |
+0.3 |
10.4 |
+1.1 |
9.3 |
0.8 |
5.0 |
-- |
349 (14.5) |
34/14 |
| PERTH AIRPORT |
20.8 |
+0.7 |
14.1 |
+5.2 |
13.9 |
3.4 |
3.8 |
9.2 |
383 (16.0) |
35/13 |
| ALBANY AIRPORT |
19.9 |
+2.6 |
9.5 |
+1.5 |
7.6 |
1.4 |
5.0 |
7.9 |
422 (17.6) |
37/12 |
| BUNBURY |
19.0 |
+0.8 |
13.7 |
+5.2 |
-- |
0.2 |
-- |
-- |
351 (14.6) |
44/13 |
| MANDURAH |
19.7 |
-- |
15.9 |
-- |
-- |
2.6 |
-- |
-- |
360 (15.0) |
48/23 |
| DARWIN AIRPORT |
34.4 |
+1.9 |
20.6 |
-2.4 |
20.0 |
0.0 |
8.8 |
10.7 |
340 (14.2) |
45/12 |
| ALICE SPRINGS AIRPORT |
29.1 |
+1.8 |
9.1 |
-1.3 |
5.1 |
0.0 |
8.8 |
11.5 |
222 ( 9.3) |
37/17 |
| WHYALLA AERO |
32.3 |
+10.8 |
10.0 |
+2.0 |
-- |
0.0 |
6.2 |
-- |
246 (10.3) |
46/12 |
| ADELAIDE (KENT TOWN) |
29.5 |
+10.5 |
12.2 |
+2.5 |
-- |
0.0 |
4.2 |
10.5 |
201 ( 8.4) |
41/11 |
| MOUNT GAMBIER AERO |
24.6 |
+8.8 |
5.8 |
-0.5 |
6.2 |
0.0 |
1.6 |
5.3 |
264 (11.0) |
43/14 |
| MOUNT ISA AERO |
30.9 |
-0.3 |
14.8 |
+0.6 |
9.0 |
0.0 |
9.6 |
11.2 |
369 (15.4) |
37/13 |
| CAIRNS AERO |
26.8 |
-1.2 |
17.9 |
-0.8 |
16.3 |
0.0 |
7.4 |
5.6 |
541 (22.5) |
48/12 |
| TOWNSVILLE AERO |
26.1 |
-1.6 |
14.3 |
-3.0 |
10.3 |
0.0 |
6.4 |
10.4 |
363 (15.1) |
39/13 |
| MACKAY M.O |
22.4 |
-2.8 |
14.7 |
-1.9 |
-- |
0.0 |
-- |
9.8 |
404 (16.8) |
39/08 |
| ROCKHAMPTON AERO |
25.6 |
-1.7 |
13.3 |
-0.3 |
11.4 |
0.0 |
6.0 |
-- |
295 (12.3) |
39/13 |
| BUNDABERG AERO |
23.8 |
-1.6 |
13.5 |
-0.2 |
-- |
1.5 |
7.7 |
-- |
390 (16.3) |
37/13 |
| NAMBOUR DPI |
22.2 |
-2.7 |
13.7 |
+3.1 |
-- |
3.42 |
-- |
-- |
78 ( 3.3) |
26/07 |
| COOLANGATTA |
21.9 |
-1.2 |
14.2 |
+0.8 |
-- |
8.6 |
-- |
-- |
313 (13.0) |
34/13 |
| BRISBANE AERO |
21.6 |
-2.6 |
13.6 |
+0.9 |
12.6 |
2.6 |
2.4 |
6.6 |
254 (10.6) |
34/14 |
| TOOWOOMBA AIRPORT |
20.0 |
-2.4 |
8.5 |
-2.1 |
-- |
0.0 |
-- |
-- |
501 (20.9) |
43/15 |
| GUNNEDAH RESOURCE CENTRE |
24.4 |
+3.0 |
11.2 |
+2.7 |
6.3 |
0.0 |
5.0 |
-- |
141 ( 5.9) |
-- |
| COFFS HARBOUR MO |
20.5 |
-1.4 |
9.5 |
-1.4 |
5.9 |
0.0 |
2.6 |
10.7 |
198 ( 8.3) |
22/12 |
| PORT MACQUARIE AIRPORT AWS |
21.0 |
-1.5 |
6.8 |
-2.6 |
-- |
0.0 |
-- |
-- |
-- |
-- |
| WILLIAMTOWN RAAF |
21.9 |
+0.7 |
5.4 |
-3.6 |
4.5 |
0.0 |
3.8 |
9.0 |
211 ( 8.8) |
30/13 |
| GOSFORD (NARARA RESEARCH STATION) AWS |
22.4 |
+1.1 |
6.4 |
-1.3 |
4.8 |
0.0 |
-- |
-- |
61 ( 2.5) |
21/12 |
| ORANGE AGRICULTURAL INSTITUTE |
19.3 |
+5.3 |
6.6 |
+2.4 |
2.4 |
0.0 |
3.2 |
7.0 |
-- |
-- |
| DUBBO AIRPORT AWS |
25.6 |
+4.4 |
7.5 |
+1.1 |
-- |
0.0 |
-- |
-- |
-- |
-- |
| SYDNEY AIRPORT AMO |
22.6 |
+2.1 |
11.9 |
+1.6 |
8.9 |
0.0 |
4.0 |
8.6 |
310 (12.9) |
35/15 |
| RICHMOND RAAF |
23.6 |
+0.9 |
6.4 |
-1.7 |
-- |
0.0 |
-- |
-- |
88 ( 3.7) |
22/12 |
| BELLAMBI AWS |
20.9 |
+0.7 |
12.7 |
+0.2 |
-- |
0.0 |
-- |
-- |
185 ( 7.7) |
41/15 |
| CANBERRA AIRPORT |
22.4 |
+6.2 |
4.7 |
+1.5 |
0.5 |
0.0 |
4.0 |
7.9 |
173 ( 7.2) |
39/15 |
| WAGGA WAGGA AMO |
24.6 |
+7.0 |
5.5 |
+0.4 |
4.2 |
0.0 |
4.6 |
10.2 |
206 ( 8.6) |
28/14 |
| ALBURY AIRPORT AWS |
23.4 |
+5.3 |
4.8 |
-1.1 |
-- |
0.0 |
-- |
-- |
60 ( 2.5) |
24/14 |
| MILDURA AIRPORT |
29.6 |
+9.2 |
9.4 |
+2.0 |
5.2 |
0.0 |
5.2 |
10.3 |
201 ( 8.4) |
37/13 |
| TATURA INST SUSTAINABLE AG |
23.2 |
+5.8 |
2.5 |
-2.9 |
-- |
0.0 |
-- |
-- |
99 ( 4.1) |
24/15 |
| BENDIGO AIRPORT |
22.0 |
+5.2 |
3.4 |
-0.9 |
-- |
0.0 |
-- |
-- |
113 ( 4.7) |
�
28/12 |
| MELBOURNE REGIONAL OFFICE |
25.7 |
+8.5 |
8.2 |
+0.3 |
6.6 |
0.0 |
2.2 |
-- |
87 ( 3.6) |
24/14 |
| GEELONG AIRPORT |
22.7 |
+5.9 |
3.5 |
-3.2 |
-- |
0.0 |
-- |
-- |
119 ( 5.0) |
34/13 |
| BALLARAT AERODROME |
19.9 |
+6.0 |
3.3 |
-1.5 |
-- |
0.0 |
-- |
-- |
193 ( 8.0) |
32/11 |
| LAUNCESTON (TI TREE BEND) |
15.5 |
0.0 |
6.9 |
+1.8 |
-- |
0.0 |
-- |
-- |
140 ( 5.8) |
35/16 |
| HOBART AIRPORT |
16.1 |
+0.8 |
10.1 |
+4.1 |
8.2 |
0.0 |
2.0 |
6.9 |
277 (11.5) |
35/16 |
| |
Max
°
C |
+/- norm
°
C |
Min
°
C |
+/- norm
°
C |
Grass Min
°
C |
Rain to 9am mm |
Evaporation to 9am mm |
Sunshine hours |
Wind Run to 9am km |
Maximum Gust km/h / hour of occurrence |
|
| Hottest |
| Highest maximum temperature> | Greatest variation above normal maximum |
Highest minimum temperature | Greatest variation above normal minimum |
38.0 BIDYADANGA W Kimberley WA
37.7 WEST ROEBUCK W Kimberley WA
37.3 WYNDHAM AERO N Kimberley WA
37.2 FITZROY CROSSING AERO W Kimberley WA
37.0 MIDDLE POINT AWS N Rivers NT
|
+14.9 : 33.7 NORTH SHIELDS (PORT LINCOLN AWS) W Agricultural SA
+13.8 : 36.4 NULLARBOR W Agricultural SA
+13.1 : 30.9 EDITHBURGH Yorke Pen/Kanga Is SA
+12.8 : 34.2 CEDUNA AMO W Agricultural SA
+12.1 : 31.3 ELLISTON W Agricultural SA
+12.1 : 30.1 MAITLAND Yorke Pen/Kanga Is SA
+12.1 : 31.0 EDINBURGH RAAF Adelaide/Lofty SA
|
26.0 NORTHERN ENDEAVOUR Islands ISL
24.7 COCOS ISLAND AIRPORT Islands ISL
24.2 COCONUT ISLAND N Peninsula QLD
24.0 TROUGHTON ISLAND N Kimberley WA
23.8 HORN ISLAND N Peninsula QLD
|
+10.5 : 19.6 EUCLA Eucla WA
+10.3 : 18.1 NULLARBOR W Agricultural SA
+9.6 : 16.0 MOUNT LOFTY Adelaide/Lofty SA
+8.5 : 16.8 MINNIPA DPI W Agricultural SA
+8.4 : 17.0 CLEVE W Agricultural SA
|
| Coldest |
| Lowest maximum temperature | Greatest variation below normal maximum |
Lowest minimum temperature | Greatest variation below normal minimum |
8.4 THREDBO AWS Snowy Mtns NSW
8.8 MOUNT WELLINGTON Southeast TAS
9.6 MT HOTHAM Upper NE VIC
10.2 MOUNT READ W Coast TAS
10.5 PERISHER VALLEY SKI CENTRE Snowy Mtns NSW
|
-4.3 : 19.4 JIMNA FORESTRY Brisbane/SE Coast QLD
-3.7 : 22.4 BEERBURRUM FOREST STATION Brisbane/SE Coast QLD
-3.6 : 21.5 LOGAN CITY WATER TREATMENT Brisbane/SE Coast QLD
-3.4 : 24.0 GREEN ISLAND N Coast--Barron QLD
|
-1.8 LIAWENEE Central Plateau TAS
-1.2 LAKE ST CLAIR NATIONAL PARK Central Plateau TAS
-1.0 OBERON (WOODCHEM) C Tablelands S NSW
0.0 THREDBO VILLAGE Snowy Mtns NSW
|
-5.7 : 9.0 RABBIT FLAT N Plateau NT
-5.5 : 12.4 WAVE HILL N Rivers NT
-5.2 : 13.2 CURTIN AERO W Kimberley WA
|
|
Sunniest &
dullest |
Windiest |
Highest gusts |
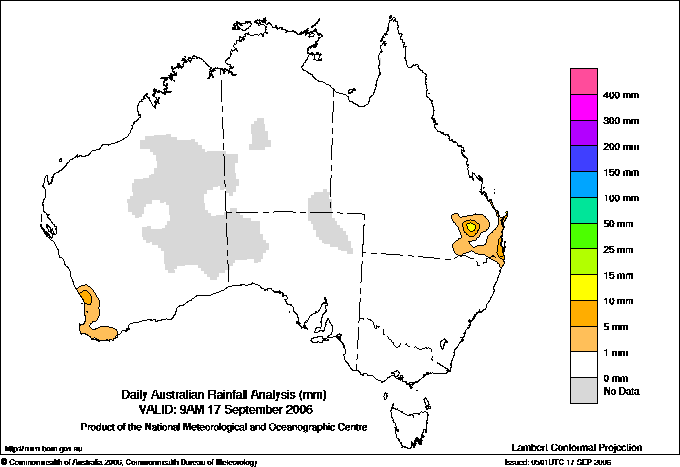
Todays highest rainfall totals for the 24 hours to 9am. It
includes the top 5 totals nationally followed by all reported falls of 50mm or more. |
Highest
and lowest recordings of hours of sunshine for the 24 hours to midnight. |
Highest wind
run totals in kilometres for the 24 hours to 9am (average speed in brackets).
All reported runs >
=25km/h are shown. |
Highest wind
gusts in km/h for the 24 hours to midnight followed by the hour in which it occurred.
All stations with gusts >
89km/h are shown. |
57.0 RUDDS LANE ALERT Brisbane/SE Coast QLD
55.0 RUDDS LANE TM Brisbane/SE Coast QLD
33.6 POINT LOOKOUT Brisbane/SE Coast QLD
30.0 POINT LOOKOUT N Tablelands E NSW
21.0 COURAN COVE Brisbane/SE Coast QLD
QUEENSLAND
Brisbane/SE Coast
57.0 RUDDS LANE ALERT
55.0 RUDDS LANE TM
33.6 POINT LOOKOUT
21.0 COURAN COVE
NEW SOUTH WALES
N Tablelands E
30.0 POINT LOOKOUT
|
11.5 GILES METEOROLOGICAL OFFICE Interior WA
11.5 ALICE SPRINGS AIRPORT N Plateau NT
11.4 MOREE AERO NW Plains E NSW
11.3 TENNANT CREEK AIRPORT N Plateau NT
11.3 RABBIT FLAT N Plateau NT
.....
5.3 MOUNT GAMBIER AERO Lower SE SA
5.3 BUNDOORA (LATROBE UNIVERSITY) E Central VIC
5.0 STRATHGORDON VILLAGE W Coast TAS
4.8 NORFOLK ISLAND AERO Islands ISL
4.5 EAST SALE AIRPORT W Gippsland VIC
|
965 (40.2) CAPE FLATTERY N Coast--Barron QLD
960 (40.0) CAPE LEEUWIN Lower West WA
892 (37.2) COCONUT ISLAND N Peninsula QLD
794 (33.1) LOW ISLES LIGHTHOUSE N Coast--Barron QLD
788 (32.8) HAMILTON ISLAND AIRPORT Central Coast E QLD
710 (29.6) RUNDLE ISLAND Wide Bay/Burnett QLD
691 (28.8) DOUBLE ISLAND POINT LIGHTHOUSE Brisbane/SE Coast QLD
634 (26.4) HORN ISLAND N Peninsula QLD
632 (26.3) LADY ELLIOT ISLAND Wide Bay/Burnett QLD
630 (26.3) LOCKHART RIVER AIRPORT S Peninsula QLD
611 (25.5) COCOS ISLAND AIRPORT Islands ISL
|
71/16 LAVERTON AERO Goldfields WA
70/23 CAPE LEEUWIN Lower West WA
68/07 CAPE WILLOUGHBY Yorke Pen/Kanga Is SA
65/18 LEINSTER AERO Goldfields WA
65/12 NORTH SHIELDS (PORT LINCOLN AWS) W Agricultural SA
|
�