|
For notes on how to interpret
the data and quality control issues, see Daily Weather Summary Help.
**S** and **W** precede data flagged by the Bureau as suspicious or wrong
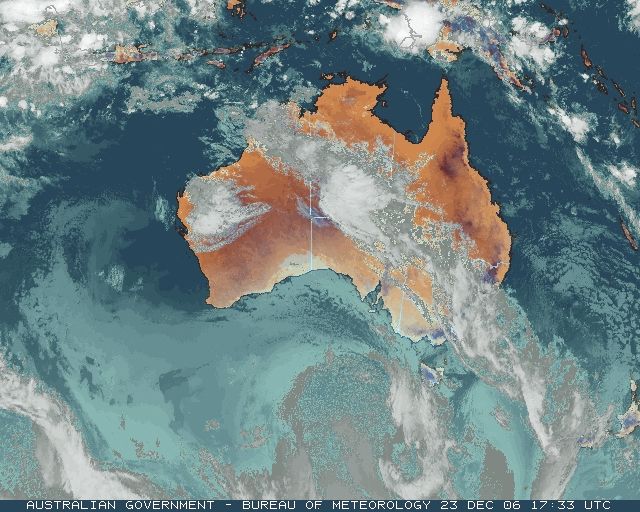
Data is as received at 23:48EST, 14/05/2012.
|
|
| |
Max
°
C |
+/- norm
°
C |
Min
°
C |
+/- norm
°
C |
Grass Min
°
C |
Rain to 9am mm |
Evaporation to 9am mm |
Sunshine hours |
Wind Run to 9am km (24-hour average km/h) |
Maximum Gust km/h / hour of occurrence |
| GERALDTON AIRPORT |
38.9 |
+9.4 |
24.8 |
+8.5 |
22.9 |
0.0 |
19.4 |
-- |
736 (30.7) |
68/13 |
| PERTH AIRPORT |
33.6 |
+4.7 |
16.6 |
+1.8 |
15.6 |
0.0 |
14.0 |
13.4 |
838 (34.9) |
84/01 |
| ALBANY AIRPORT |
23.8 |
+0.7 |
14.6 |
+2.2 |
11.9 |
0.0 |
8.6 |
9.9 |
646 (26.9) |
61/14 |
| BUNBURY |
32.7 |
+5.6 |
15.5 |
+2.2 |
-- |
0.0 |
-- |
-- |
529 (22.0) |
50/00 |
| MANDURAH |
33.7 |
-- |
17.0 |
-- |
-- |
0.0 |
-- |
-- |
498 (20.8) |
52/07 |
| DARWIN AIRPORT |
35.5 |
+2.9 |
25.7 |
+0.4 |
25.6 |
0.0 |
9.2 |
-- |
420 (17.5) |
41/15 |
| ALICE SPRINGS AIRPORT |
20.3 |
-15.1 |
17.8 |
-2.4 |
17.8 |
17.8 |
13.0 |
0.5 |
480 (20.0) |
45/00 |
| WHYALLA AERO |
20.8 |
-7.3 |
14.9 |
-0.9 |
-- |
0.0 |
8.0 |
-- |
622 (25.9) |
52/15 |
| ADELAIDE (KENT TOWN) |
20.6 |
-6.4 |
10.5 |
-5.0 |
7.1 |
0.0 |
6.2 |
5.9 |
297 (12.4) |
46/02 |
| MOUNT GAMBIER AERO |
17.8 |
-5.1 |
5.8 |
-4.1 |
2.7 |
0.0 |
5.6 |
5.4 |
429 (17.9) |
63/13 |
| MOUNT ISA AERO |
35.1 |
-2.1 |
24.5 |
+1.4 |
21.4 |
0.0 |
11.0 |
4.5 |
292 (12.2) |
54/16 |
| CAIRNS AERO |
31.2 |
-0.2 |
23.1 |
-0.3 |
20.7 |
0.0 |
10.6 |
11.6 |
452 (18.8) |
32/10 |
| TOWNSVILLE AERO |
30.7 |
-0.8 |
23.1 |
-1.0 |
21.1 |
0.4 |
8.0 |
12.0 |
489 (20.4) |
41/13 |
| MACKAY M.O |
30.3 |
+0.2 |
21.0 |
-1.9 |
-- |
0.0 |
-- |
10.5 |
333 (13.9) |
26/11 |
| ROCKHAMPTON AERO |
30.7 |
-1.4 |
20.3 |
-0.9 |
19.4 |
0.0 |
9.8 |
-- |
330 (13.8) |
37/12 |
| BUNDABERG AERO |
29.6 |
+0.2 |
16.6 |
-3.9 |
-- |
0.0 |
7.5 |
-- |
297 (12.4) |
39/14 |
| NAMBOUR DPI |
28.9 |
-0.3 |
12.1 |
-6.1 |
-- |
0.0 |
-- |
-- |
91 ( 3.8) |
32/15 |
| COOLANGATTA |
27.8 |
+0.6 |
18.6 |
-1.3 |
-- |
0.0 |
-- |
-- |
424 (17.7) |
50/12 |
| BRISBANE AERO |
27.5 |
-0.8 |
15.8 |
-4.3 |
-- |
0.0 |
9.4 |
13.1 |
453 (18.9) |
48/20 |
| TOOWOOMBA AIRPORT |
28.9 |
+1.2 |
13.7 |
-3.0 |
-- |
0.0 |
-- |
-- |
368 (15.3) |
35/15 |
| GUNNEDAH RESOURCE CENTRE |
29.5 |
-1.5 |
22.9 |
+5.4 |
17.3 |
0.0 |
6.4 |
-- |
171 ( 7.1) |
-- |
| COFFS HARBOUR MO |
26.8 |
+0.5 |
17.8 |
-0.3 |
15.5 |
0.0 |
6.8 |
12.6 |
581 (24.2) |
63/14 |
| PORT MACQUARIE AIRPORT AWS |
27.9 |
+1.3 |
19.4 |
+2.7 |
-- |
0.0 |
-- |
-- |
-- |
-- |
| WILLIAMTOWN RAAF |
29.2 |
+2.0 |
20.4 |
+3.9 |
20.0 |
1.0 |
5.0 |
1.9 |
316 (13.2) |
43/15 |
| GOSFORD (NARARA RESEARCH STATION) AWS |
27.7 |
+0.8 |
19.6 |
+4.3 |
19.8 |
1.0 |
-- |
-- |
102 ( 4.3) |
24/13 |
| ORANGE AGRICULTURAL INSTITUTE |
19.1 |
-5.3 |
16.2 |
+4.9 |
15.0 |
7.4 |
6.8 |
0.4 |
-- |
-- |
| DUBBO AIRPORT AWS |
28.5 |
-3.0 |
20.6 |
+4.7 |
-- |
1.0 |
-- |
-- |
-- |
-- |
| SYDNEY AIRPORT AMO |
21.8 |
-3.9 |
18.1 |
+0.6 |
17.4 |
3.4 |
3.6 |
0.3 |
478 (19.9) |
41/12 |
| RICHMOND RAAF |
24.6 |
-4.1 |
19.2 |
+3.2 |
-- |
5.0 |
-- |
-- |
201 ( 8.4) |
34/11 |
| BELLAMBI AWS |
18.6 |
-5.5 |
17.0 |
-0.5 |
-- |
10.4 |
-- |
-- |
353 (14.7) |
26/05 |
| CANBERRA AIRPORT |
27.9 |
+1.8 |
16.4 |
+5.0 |
15.5 |
2.6 |
5.6 |
7.8 |
307 (12.8) |
54/13 |
| WAGGA WAGGA AMO |
26.2 |
-3.2 |
13.4 |
-0.3 |
11.5 |
3.0 |
7.6 |
8.3 |
377 (15.7) |
52/13 |
| ALBURY AIRPORT AWS |
26.5 |
-2.9 |
11.3 |
-2.4 |
-- |
0.0 |
-- |
-- |
316 (13.2) |
43/15 |
| MILDURA AIRPORT |
24.2 |
-5.9 |
11.6 |
-3.2 |
10.2 |
0.0 |
10.2 |
13.1 |
388 (16.2) |
50/19 |
| TATURA INST SUSTAINABLE AG |
23.7 |
-3.7 |
8.9 |
-3.3 |
-- |
0.0 |
-- |
-- |
560 (23.3) |
54/20 |
| BENDIGO AIRPORT |
22.2 |
-4.8 |
7.5 |
-4.0 |
-- |
0.0 |
-- |
-- |
482 (20.1) |
�
54/19 |
| MELBOURNE REGIONAL OFFICE |
20.7 |
-3.5 |
13.1 |
+0.2 |
10.9 |
0.0 |
5.0 |
-- |
124 ( 5.2) |
28/18 |
| GEELONG AIRPORT |
19.8 |
-3.1 |
8.4 |
-2.5 |
-- |
0.0 |
-- |
-- |
453 (18.9) |
63/14 |
| BALLARAT AERODROME |
18.3 |
-4.3 |
5.9 |
-3.5 |
-- |
0.0 |
-- |
-- |
540 (22.5) |
61/14 |
| LAUNCESTON (TI TREE BEND) |
19.6 |
-2.8 |
11.0 |
+0.4 |
-- |
0.0 |
-- |
-- |
297 (12.4) |
52/15 |
| HOBART AIRPORT |
19.2 |
-1.4 |
10.8 |
+0.1 |
8.6 |
0.0 |
7.6 |
3.1 |
459 (19.1) |
54/15 |
| |
Max
°
C |
+/- norm
°
C |
Min
°
C |
+/- norm
°
C |
Grass Min
°
C |
Rain to 9am mm |
Evaporation to 9am mm |
Sunshine hours |
Wind Run to 9am km |
Maximum Gust km/h / hour of occurrence |
|
| Hottest |
| Highest maximum temperature> | Greatest variation above normal maximum |
Highest minimum temperature | Greatest variation above normal minimum |
42.4 PORT HEDLAND AIRPORT E Pilbara WA
42.3 ROEBOURNE AERO E Pilbara WA
41.6 MANDORA E Pilbara WA
41.3 MARDIE W Pilbara WA
41.2 NYANG STATION W Gascoyne WA
|
+10.9 : 39.0 JURIEN BAY Lower West WA
+9.8 : 37.0 LANCELIN Lower West WA
+9.4 : 38.9 GERALDTON AIRPORT Central West WA
+8.2 : 37.2 DENHAM W Gascoyne WA
+7.9 : 39.9 SHARK BAY AIRPORT W Gascoyne WA
|
29.8 ROEBOURNE AERO E Pilbara WA
29.6 BIDYADANGA W Kimberley WA
29.4 ROEBOURNE E Pilbara WA
29.0 PORT HEDLAND AIRPORT E Pilbara WA
|
+9.6 : 24.7 WELLINGTON (AGROWPLOW) CW Slopes S NSW
+8.5 : 24.8 GERALDTON AIRPORT Central West WA
+8.0 : 24.9 MULLEWA Central West WA
+6.8 : 22.8 CARNAMAH Central West WA
+6.8 : 21.6 QUIRINDI POST OFFICE NW Slopes S NSW
|
| Coldest |
| Lowest maximum temperature | Greatest variation below normal maximum |
Lowest minimum temperature | Greatest variation below normal minimum |
5.1 MOUNT READ W Coast TAS
9.0 MT BAW BAW W Gippsland VIC
10.0 GRAMPIANS (MOUNT WILLIAM) Wimmera S VIC
11.0 MOUNT LOFTY Adelaide/Lofty SA
11.6 THREDBO AWS Snowy Mtns NSW
|
-16.3 : 21.5 JERVOIS N Plateau NT
-15.1 : 20.3 ALICE SPRINGS AIRPORT N Plateau NT
-15.1 : 19.1 ARLTUNGA N Plateau NT
-14.3 : 23.5 ALI CURUNG N Plateau NT
-13.7 : 21.5 TIBOOBURRA AIRPORT Far Northwest NSW
|
-0.6 MT BAW BAW W Gippsland VIC
0.5 MOUNT READ W Coast TAS
1.0 GRAMPIANS (MOUNT WILLIAM) Wimmera S VIC
1.0 MOUNT WELLINGTON Southeast TAS
2.7 LOOKOUT HILL Western Plains VIC
|
-8.4 : 5.0 ECHUCA AERODROME Lower North VIC
-7.6 : 10.9 GYMPIE Brisbane/SE Coast QLD
-7.4 : 3.3 CASTLEMAINE PRISON N Central VIC
-6.6 : 5.0 HORSHAM (POLKEMMET) Wimmera S VIC
-6.3 : 3.3 SMITHTON AERODROME N Coast TAS
-6.3 : 14.4 RAINBOW BEACH Brisbane/SE Coast QLD
-6.3 : 13.5 MAROOCHYDORE AERO Brisbane/SE Coast QLD
|
|
Sunniest &
dullest |
Windiest |
Highest gusts |
Todays highest rainfall totals for the 24 hours to 9am. It
includes the top 5 totals nationally followed by all reported falls of 50mm or more. |
Highest
and lowest recordings of hours of sunshine for the 24 hours to midnight. |
Highest wind
run totals in kilometres for the 24 hours to 9am (average speed in brackets).
All reported runs >
=25km/h are shown. |
Highest wind
gusts in km/h for the 24 hours to midnight followed by the hour in which it occurred.
All stations with gusts >
89km/h are shown. |
78.2 MURRAY DOWNS N Plateau NT
71.0 AMBURLA N Plateau NT
66.2 MOUNT SKINNER N Plateau NT
57.0 HALLS CREEK AIRPORT E Kimberley WA
55.0 NOWRA RAN AIR STATION AWS Illawarra NSW
WESTERN AUSTRALIA
E Kimberley
57.0 HALLS CREEK AIRPORT
55.0 MARGARET RIVER
NORTHERN TERRITORY
N Plateau
78.2 MURRAY DOWNS
71.0 AMBURLA
66.2 MOUNT SKINNER
54.0 TREPHINA GORGE
NEW SOUTH WALES
Illawarra
55.0 NOWRA RAN AIR STATION AWS
52.4 NERRIGA (TOLWONG)
|
13.4 PERTH AIRPORT Lower West WA
13.1 BRISBANE AERO Brisbane/SE Coast QLD
13.1 MILDURA AIRPORT Mallee N VIC
13.0 WOOMERA AERODROME NW Pastoral SA
12.6 COFFS HARBOUR MO MidNorth Coast N NSW
.....
0.6 TENNANT CREEK AIRPORT N Plateau NT
0.5 ALICE SPRINGS AIRPORT N Plateau NT
0.4 ORANGE AGRICULTURAL INSTITUTE C Tablelands S NSW
0.3 SYDNEY AIRPORT AMO Sydney--east NSW
0.0 WARWICK Darling Downs E QLD
|
1173 (48.9) CAPE LEEUWIN Lower West WA
1055 (44.0) CAPE GRIM BAPS N Coast TAS
874 (36.4) HOGAN ISLAND Islands ISL
863 (36.0) WILSONS PROMONTORY LIGHTHOUSE W Gippsland VIC
838 (34.9) PERTH AIRPORT Lower West WA
834 (34.8) WILLIS ISLAND Islands ISL
799 (33.3) LOW HEAD N Coast TAS
762 (31.8) CEDUNA AMO W Agricultural SA
760 (31.7) HINDMARSH ISLAND AWS Adelaide/Lofty SA
739 (30.8) THREDBO AWS Snowy Mtns NSW
736 (30.7) GERALDTON AIRPORT Central West WA
736 (30.7) CAPE FLATTERY N Coast--Barron QLD
733 (30.5) COCONUT ISLAND N Peninsula QLD
729 (30.4) PORT HEDLAND AIRPORT E Pilbara WA
721 (30.0) CAPE NATURALISTE Lower West WA
715 (29.8) PEARCE RAAF Lower West WA
713 (29.7) PORT AUGUSTA AERO W Agricultural SA
705 (29.4) HAMILTON ISLAND AIRPORT Central Coast E QLD
701 (29.2) DEVONPORT AIRPORT N Coast TAS
694 (28.9) ROTTNEST ISLAND Lower West WA
678 (28.3) KILMORE GAP N Central VIC
674 (28.1) HORN ISLAND N Peninsula QLD
673 (28.0) SWAN ISLAND E Coast TAS
670 (27.9) ALVA BEACH Central Coast E QLD
664 (27.7) CAPE WILLOUGHBY Yorke Pen/Kanga Is SA
663 (27.6) WOOMERA AERODROME NW Pastoral SA
646 (26.9) ALBANY AIRPORT Lower West WA
644 (26.8) NORTH ISLAND Central West WA
643 (26.8) GINGIN AERO Lower West WA
642 (26.8) NEPTUNE ISLAND W Agricultural SA
637 (26.5) CAPE JAFFA (CURLEY HILLS) Lower SE SA
626 (26.1) NULLARBOR W Agricultural SA
626 (26.1) GREEN CAPE AWS South Coast NSW
622 (25.9) MCCLUER ISLAND N Rivers NT
622 (25.9) WHYALLA AERO W Agricultural SA
621 (25.9) ROEBOURNE AERO E Pilbara WA
619 (25.8) LAVERTON AERO Goldfields WA
617 (25.7) COOBER PEDY AIRPORT NW Pastoral SA
608 (25.3) LOW ISLES LIGHTHOUSE N Coast--Barron QLD
605 (25.2) KING ISLAND AIRPORT King Island TAS
600 (25.0) BYRON BAY (CAPE BYRON AWS) North Coast NSW
|
89/23 WILSONS PROMONTORY LIGHTHOUSE W Gippsland VIC
87/17 HOGAN ISLAND Islands ISL
84/01 PERTH AIRPORT Lower West WA
83/20 MOUNT READ W Coast TAS
81/22 CAPE GRIM BAPS N Coast TAS
|
�